Delivering Ready Mix Concrete Monday – Saturday
The global cement industry is a critical component of infrastructure development, with production and ownership structures reflecting economic, political, and environmental dynamics. This note provides a comprehensive analysis of who produces and owns cement worldwide, based on recent data and industry trends as of May 31, 2025. It expands on the key points and includes detailed insights into major producers, country-level production, and ownership structures.
Global Cement Production Landscape
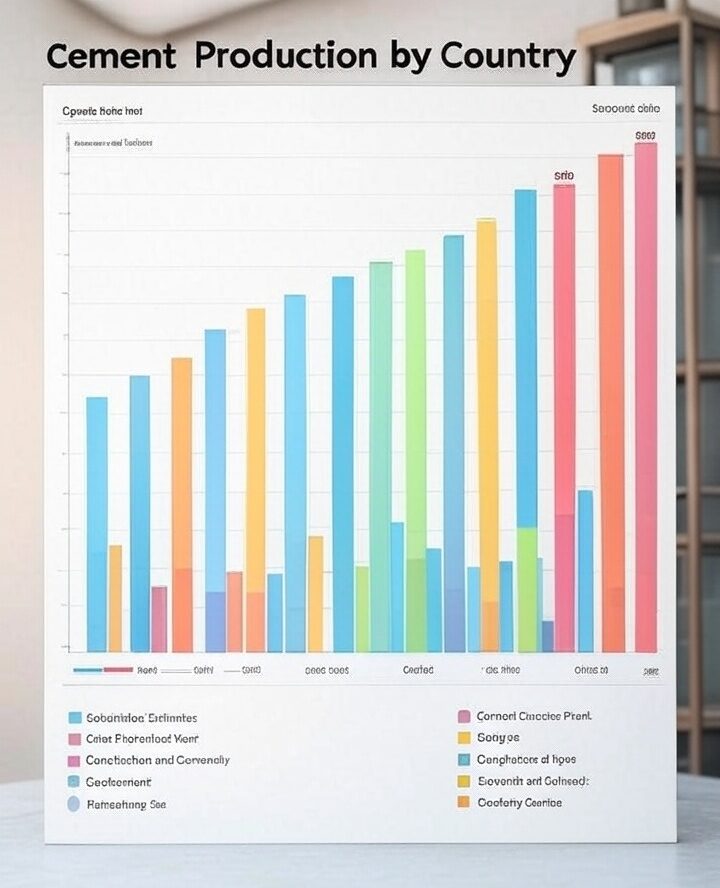
Cement production is heavily concentrated in certain countries, with China leading by a significant margin. In 2023, China produced over 2.1 billion metric tons, accounting for approximately 50% of global output.
India follows with 410 million metric tons, and Vietnam with 110 million metric tons, highlighting Asia’s dominance in the sector. This concentration is driven by rapid urbanization and infrastructure projects, particularly in China, where cement is a cornerstone of construction, unlike regions like the United States, where wood is more common for housing.
The industry faces challenges, including environmental concerns, with large-scale production contributing to pollution, especially in China, where state support has boosted over-production.
Sustainability efforts, such as reducing CO2 emissions, are increasingly important, with companies like HeidelbergCement and Holcim investing in alternative fuels and low-carbon technologies.
Major Cement Producers and Their Capacities
The largest cement companies by production capacity, based on 2024 and 2025 data, are as follows:
| Rank | Company Name | Production Capacity (Million Metric Tons/Year) | Headquarters |
|---|---|---|---|
| 1 | China National Building Material Co. Ltd. (CNBM) | 530 | China |
| 2 | Anhui Conch Cement Company Limited | 288 | China |
| 3 | Holcim | 274 | Switzerland |
| 4 | HeidelbergCement | 121 | Germany |
| 5 | Cemex | 87 | Mexico |
This table is derived from recent industry reports, such as Statista – Capacity of biggest global cement producers 2024 and Construction Kenya – Top 10 Largest Cement Producers. Note that there was a discrepancy in earlier data, with some sources listing CNBM’s capacity lower (e.g., 176.22 million metric tons), but the most recent Statista data (March 2025) confirms 530 million, suggesting updates in capacity or reporting methods.
Other notable producers include China Resources Cement Holdings (71 million metric tons, state-owned), Taiwan Cement Corporation (64 million metric tons, publicly traded), Eurocement (45 million metric tons, likely private with possible state ties in Russia), and Votorantim Cimentos (45 million metric tons, privately held by the Brazilian Votorantim Group).
Ownership Structures and State Influence
Ownership is a critical aspect, with significant variation across companies:
- State-Owned Enterprises (SOEs):
- CNBM is fully state-owned by the Chinese government, reflecting China’s strategy to control key industries
.
- China Resources Cement Holdings is part of China Resources, another state-owned enterprise, emphasizing state dominance in China’s cement sector.
- Anhui Conch, while publicly listed on the Hong Kong and Shanghai Stock Exchanges, has its largest shareholder, Anhui Conch Holdings, owned by the Anhui Provincial People’s Government via subsidiaries like Anhui Provincial Investment Group Holdings Co., Ltd. and China Conch Venture Holdings
. This structure indicates significant state influence, with the government controlling major stakes.
- CNBM is fully state-owned by the Chinese government, reflecting China’s strategy to control key industries
- Publicly Traded Companies:
- Holcim, headquartered in Switzerland, is publicly traded on the SIX Swiss Exchange, formed by the merger of Lafarge and Holcim in 2015
. It operates in over 90 countries, focusing on sustainability and innovation.
- HeidelbergCement, based in Germany, is listed on the Frankfurt Stock Exchange, with operations in over 50 countries, emphasizing sustainable practices like reducing CO2 emissions
.
- Cemex, headquartered in Mexico, is listed on both the Mexican Stock Exchange and the New York Stock Exchange, serving the Americas and beyond
.
- Taiwan Cement Corporation, based in Taiwan, is publicly traded, reflecting the region’s industrial focus
.
- Holcim, headquartered in Switzerland, is publicly traded on the SIX Swiss Exchange, formed by the merger of Lafarge and Holcim in 2015
- Private Companies:
- Votorantim Cimentos, the largest in Brazil, is privately held by the Votorantim Group, a conglomerate with diverse interests
.
- Eurocement, Russia’s largest, is likely private, though large Russian companies often have indirect state ties, though specific ownership details were not fully clarified in the data
.
- Votorantim Cimentos, the largest in Brazil, is privately held by the Votorantim Group, a conglomerate with diverse interests
Mergers, Acquisitions, and Industry Dynamics
The cement industry has seen significant consolidation, affecting ownership and market share. For instance, Holcim was formed by the merger of Lafarge and Holcim in July 2015, creating one of the largest global players.
Similarly, Italcementi (Italy) became part of HeidelbergCement in 2016, expanding its global footprint.
Technological advancements, such as AI in supply chain optimization, are enhancing operational efficiency, with companies like Anhui Conch collaborating with Huawei on AI models for cement production.
These innovations are crucial for meeting growing demand, driven by infrastructure projects and government initiatives, particularly in Asia
Economic and Environmental Implications
Cement production is closely tied to economic growth, with demand often reflecting real estate and infrastructure activity.
However, the environmental impact is significant, with China’s cement industry criticized for pollution despite economic benefits.
Companies are responding with sustainability goals, such as Anhui Conch’s target to reduce emissions intensity by 6% by 2025 compared to 2020, aligning with China’s carbon peak and neutrality goals
Conclusion
In summary, no single entity produces or owns all the cement in the world; instead, the industry is dominated by a mix of state-owned enterprises (especially in China), publicly traded companies, and private firms. Chinese companies like CNBM (state-owned, 530 million metric tons/year) and Anhui Conch (state-influenced, 288 million metric tons/year) lead in capacity, followed by international players like Holcim (publicly traded, 274 million metric tons/year) and HeidelbergCement (publicly traded, 121 million metric tons/year). Ownership structures reflect national policies, with China’s state control contrasting with the public and private models in other regions. This diversity underscores the global and multifaceted nature of the cement industry as of May 31, 2025.
Key Citations
- Construction Kenya Top 10 Largest Cement Producers
- Statista Capacity of biggest global cement producers 2024
- World Population Review Cement Production by Country 2025
- Wikipedia Anhui Conch Cement
- Forbes Anhui Conch Cement Company Overview
- WorldAtlas Top Cement Producing Countries
- Building Radar Top 15 Largest Cement Companies
- Yahoo Finance 20 Largest Cement Producing Countries
- Global Cement Anhui Conch
- World Benchmarking Alliance Heavy Industries Benchmark
Global Cement Market Overview 2025
This post explores the world cement market, highlighting production by country, key producers’ capacities, and ownership details. Data is based on 2023-2024 figures and 2025 projections from sources like Statista, World Population Review, and IMARC Group.
Cement Production by Country (Million Metric Tons, 2023 & 2025 Est.)
Key Producers, Capacity, and Ownership
| Company | Headquarters | Production Capacity (Million Metric Tons/Year, 2024) | Ownership |
|---|---|---|---|
| China National Building Material (CNBM) | China | 530 | State-owned |
| Anhui Conch Cement | China | 288 | Publicly listed, state-influenced |
| Holcim | Switzerland | 274 | Publicly traded |
| HeidelbergCement | Germany | 121 | Publicly traded |
| Cemex | Mexico | 87 | Publicly traded |
Market Insights:
- Total Production (2023): 4.1 billion metric tons, estimated to remain stable or grow slightly by 2025 due to demand in Asia, Africa, and infrastructure projects.
- Market Value: Valued at USD 407.4 billion in 2024, projected to reach USD 673.8 billion by 2033 (CAGR 5.16%).
- Trends: Shift toward sustainable cement (e.g., blended cement with fly ash, slag), driven by environmental regulations and urbanization.
- Key Drivers: Population growth, infrastructure investments (e.g., India’s Smart Cities Mission), and eco-friendly production innovations.
-

Budget E-Bikes for Outdoor Adventures in the Pacific Northwest
Exploring Oregon’s Rugged Terrain: Budget E-Bikes ($1,000-$2,500) for Outdoor Adventures & Bigfoot Spotting Hey folks, from the team at Volume Concrete here in the Greater Portland Metro area! While we’re all about delivering top-notch ready-mix concrete for your construction needs, we also have a soft spot for Oregon’s incredible natural landscapes—and the mysteries they hold.…
-

Ready-Mix Truck Turnaround Tracker
Ready-Mix Truck Timeline Calculator with Job Details & Graph Ready-Mix Truck Turnaround Tracker Fleet Size (1-20): Travel Time (Plant to Job) (minutes): Time at Jobsite (minutes): Time at Batchplant (minutes): Yardage Per Truck (cu yd): Pour Start Time (HH:MM): Jobsite Name: Jobsite Address: Get Travel Time (Google Maps) Pour Date: Truck Batch Spacing (minutes): Customer…
-

How to Order Concrete Like a Pro
How to Order Concrete: A Step-by-Step Guide from Volume Concrete LLC. Ordering the right concrete is crucial for the success and durability of your project. At Volume Concrete, powered by the pumping expertise of AAA Concrete Pumping, we’re here to guide you through every step. Our slogan, “The Leaders in Long Distance,” reflects our commitment…
-

Euclid Stasis Dosage Chart
Euclid Stasis Dosage Chart Calculate the recommended dosage rate for Euclid Stasis based on ambient temperature and time delay. Ambient Temperature (°F): ⓘ Time Delay (minutes): ⓘ Cement Content (cwt): ⓘ Calculate Dosage Result: Please enter the values above and click ‘Calculate Dosage’. Euclid Stasis Dosage Recommendations (fl oz/cwt) Note: The chart provides values for…
-

Common Conversions for Construction & Donuts for the Crew
A practical HTML5 tool for common construction unit conversions (feet, sq ft, cu yd, lbs). Plus, a fun jobsite donut calculator and a methodical planner for the perfect morale-boosting donut box! Construction Site Assistant & Donut Planner 🍩 Construction Site Assistant & Donut Planner 🍩 Standard Unit Conversions Feet (ft): Convert to Meters Convert to…
-

Concrete Mix Design Tool
Concrete Mix Design Tool Tailor your concrete mix for a consistent 27 cubic feet (1 cubic yard) volume. This tool aligns with VolumeConcrete.com standards, incorporating common Eucon Admixtures. Material Specific Gravities (Adjustable) Rock (Coarse Aggregate) SG: Sand (Fine Aggregate) SG: Cement SG: (Water density: 62.4 lbs/ft³) Mix Parameters (Adjust Sliders) Water/Cement (W/C) Ratio: 0.45 Sand…
-

Interactive Historical Chart: The Enduring Legacy of Concrete, Cement, and Pozzolan
Concrete. It’s the most widely used man-made material on Earth, forming the very backbone of our modern world. But its story stretches back millennia, woven with tales of ingenuity, accidental discoveries, and groundbreaking innovation. From ancient civilizations harnessing volcanic ash to today’s high-performance, sustainable mixes, the journey of concrete, cement, and their remarkable predecessor, pozzolan,…
-

Water to Cement Ratio Relationship to Strength in Ready Mix Concrete
Water-Cement Ratio & Concrete Strength Calculator The Water-Cement Ratio (W/C) is one of the most critical factors influencing the strength, workability, and durability of concrete and grout. It’s simply the weight of water divided by the weight of cement used in a concrete mix. Lower W/C ratios generally lead to stronger, more durable, and less…
-

Annular Space Calculator
Annular Space Volume Calculator Annular Space Concrete Volume Calculator This tool calculates the volume of concrete needed to fill the annular space between two concentric cylinders, such as in well casings or pipe installations. Unit System: Imperial (inches/feet)Metric (cm/meters) Outer Diameter (inches): Inner Diameter (inches): Depth/Height (feet): Waste Factor (%): Bag Size for Estimate: None60…
-

Concrete Industry FAFO Calculator
Concrete FAFO Calculator 🏗️ Certified by Concrete Meme Standards Board (ISO 1337-Build) Fuck Around Level in Concrete Work (0-100): Current FA: 0 🛠️ Max Safe Concrete FA: 80 | Beyond: Structural Doom! 💥