Volume Concrete Mix Design Suggester
Suggested Mix Designs
Please select options from above to see suggestions.

Please select options from above to see suggestions.

Discover the ultimate Pool Concrete Calculator at VolumeConcrete.com! Easily estimate cubic yards of concrete needed for your rectangular pool with adjustable length, width, shallow and deep depths, and detailed step specifications (width, tread depth, riser height, and number of steps). Perfect for planning your backyard oasis, this user-friendly tool includes 10-15% overspray adjustment and options to print or save as PDF. Optimize your pool construction today with accurate, real-time calculations!
The calculator follows this process, based on standard construction practices:
Example Calculation

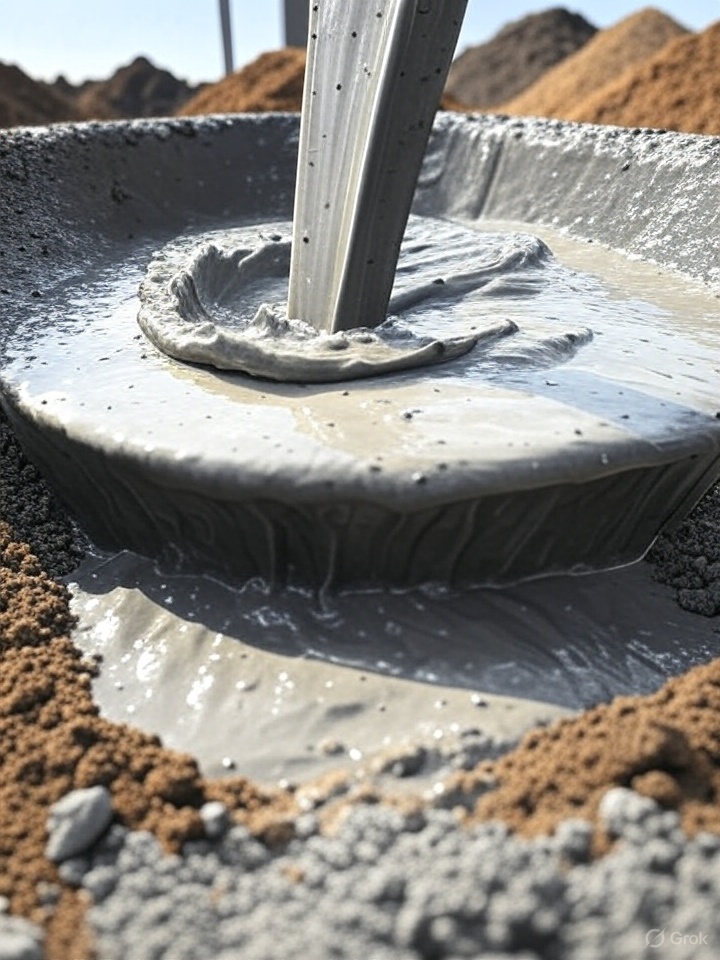
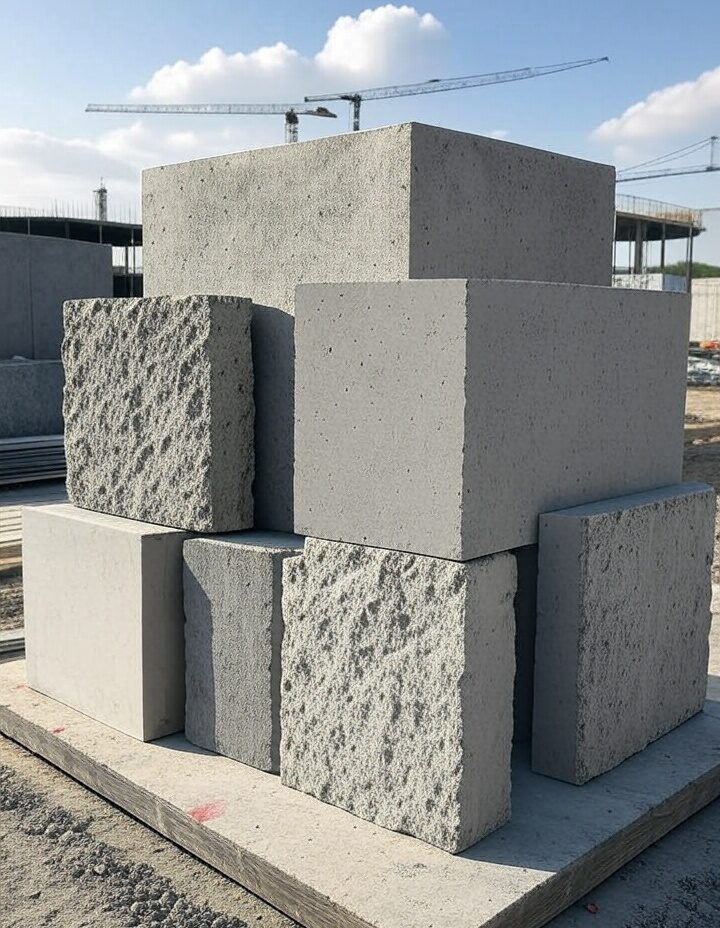
Cement slurry, often referred to as neat cement, is a fundamental and versatile material in the construction industry, playing a critical role in ensuring the durability and stability of various projects. At Volume Concrete, we specialize in providing high-quality cement slurry tailored for specific applications, including cellular concrete production, grouting, and other innovative uses. This detailed overview, as of June 11, 2025, aims to educate and inform, covering the composition, properties, applications, and the specific advantages of Volume Concrete’s product, ensuring you have all the information needed for your construction needs.
Definition and Composition
Cement slurry is defined as a homogeneous mixture of cement, water, and sometimes chemical additives, designed to create a pourable consistency. It is commonly used in construction to create strong and stable foundations, particularly in areas with soft or unstable soil. When poured onto wet ground, it binds with the soil, forming a hard, smooth, and water-resistant layer. The thickness can vary depending on the project, typically applied by pumping into a space or pouring from a cement truck chute.
The composition is critical, as it directly influences the slurry’s performance. For instance, Volume Concrete’s most popular slurry has a 0.6 w/c ratio, which we’ll explore further for its implications on strength and workability.
Properties and Technical Specifications
The properties of cement slurry are determined by its composition and are crucial for its application. Key properties include:
Applications and Uses
Cement slurry’s versatility makes it indispensable across various construction scenarios. Here, we detail its primary and innovative applications, including those specifically mentioned by Volume Concrete and additional ideas for potential uses:
These applications highlight cement slurry’s role in both traditional and cutting-edge construction, with Volume Concrete’s product well-suited for many of these needs.
Volume Concrete’s Specific Product and Advantages
Volume Concrete’s most popular cement slurry is formulated with a 0.6 w/c ratio and a pot weight of 108 pcf, ensuring optimal performance for cellular concrete, grouting, and other applications. This formulation is calculated to have a density of approximately 108.8 pcf, aligning with expectations for a base slurry before foam addition for cellular concrete.
This focus on quality and adaptability makes Volume Concrete’s slurry a top choice for contractors and builders.
Future Trends and Innovations
Looking ahead, cement slurry is at the forefront of innovative construction techniques, reflecting its evolving role:
These trends underscore cement slurry’s potential to meet the evolving needs of the construction industry, with Volume Concrete positioned to support these advancements.
Importance and Conclusion
Choosing the right cement slurry is crucial for the success of any construction project, ensuring durability, structural integrity, and cost-effectiveness. At Volume Concrete, we understand this importance and are committed to delivering top-tier cement slurry that meets the highest standards of quality and performance. Whether you’re producing cellular concrete, grouting foundations, or exploring innovative applications, our slurry, with its 0.6 w/c ratio and 108 pcf pot weight, is designed to empower builders and contractors with reliability and versatility.
This comprehensive overview, as of June 11, 2025, aims to provide all the details you need to make informed decisions for your construction projects, highlighting cement slurry’s role as a cornerstone of modern construction.
Key Citations
Enter your values below and click “Calculate” to find the total time to mix, unload, and wheelbarrow concrete bags.
| Bag Size (pounds) | Volume (cubic feet) |
|---|---|
| 40 | 0.30 |
| 60 | 0.45 |
| 80 | 0.60 |
| 94 | 0.71 |
Note: If your bag size isn’t listed, check the product packaging for volume (cubic feet) and adjust your inputs accordingly.
Calculate the time needed to mix, unload, and wheelbarrow concrete bags with our simple Concrete Mixing Time Calculator! This tool helps you estimate the total time for your project based on mixer capacity, bag size, number of bags, and typical task durations. Input your values, follow the step-by-step guide, and use the reference table for common bag sizes to compute your result manually. Perfect for contractors, DIY enthusiasts, and anyone planning a concrete project!
Delivering Ready Mix Concrete Monday – Saturday
The global cement industry is a critical component of infrastructure development, with production and ownership structures reflecting economic, political, and environmental dynamics. This note provides a comprehensive analysis of who produces and owns cement worldwide, based on recent data and industry trends as of May 31, 2025. It expands on the key points and includes detailed insights into major producers, country-level production, and ownership structures.
Global Cement Production Landscape
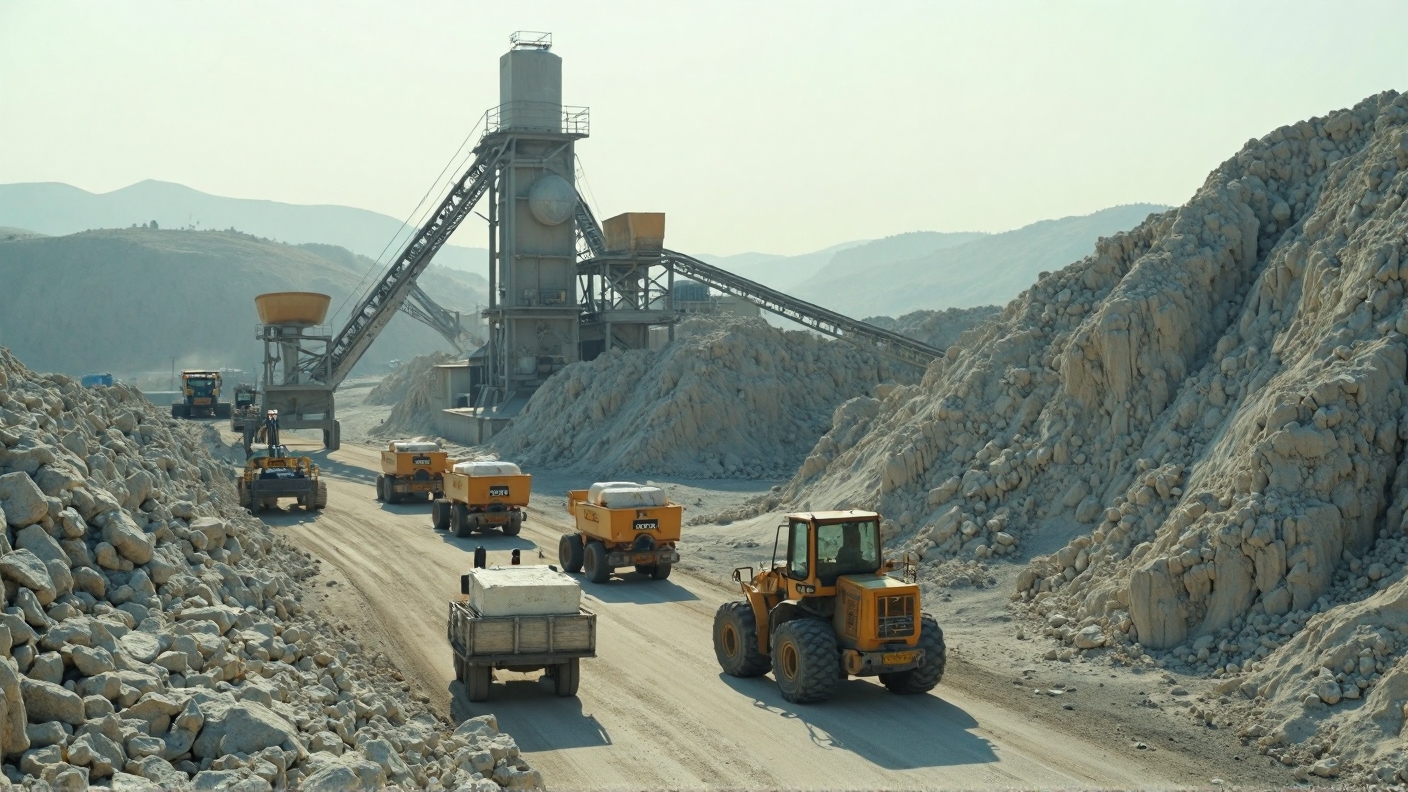
Cement production is heavily concentrated in certain countries, with China leading by a significant margin. In 2023, China produced over 2.1 billion metric tons, accounting for approximately 50% of global output.
India follows with 410 million metric tons, and Vietnam with 110 million metric tons, highlighting Asia’s dominance in the sector. This concentration is driven by rapid urbanization and infrastructure projects, particularly in China, where cement is a cornerstone of construction, unlike regions like the United States, where wood is more common for housing.
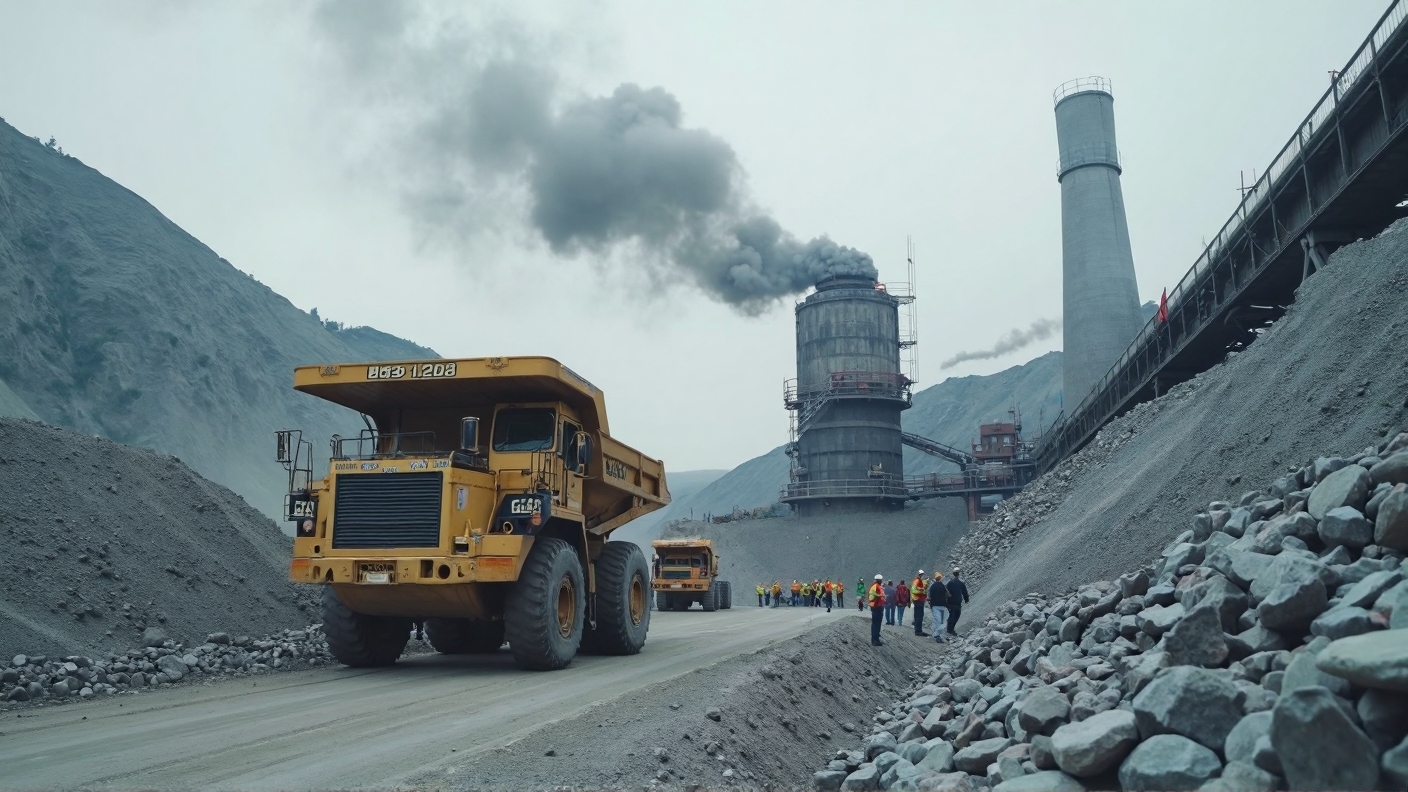
The industry faces challenges, including environmental concerns, with large-scale production contributing to pollution, especially in China, where state support has boosted over-production.
Sustainability efforts, such as reducing CO2 emissions, are increasingly important, with companies like HeidelbergCement and Holcim investing in alternative fuels and low-carbon technologies.
Major Cement Producers and Their Capacities
The largest cement companies by production capacity, based on 2024 and 2025 data, are as follows:
| Rank | Company Name | Production Capacity (Million Metric Tons/Year) | Headquarters |
|---|---|---|---|
| 1 | China National Building Material Co. Ltd. (CNBM) | 530 | China |
| 2 | Anhui Conch Cement Company Limited | 288 | China |
| 3 | Holcim | 274 | Switzerland |
| 4 | HeidelbergCement | 121 | Germany |
| 5 | Cemex | 87 | Mexico |
This table is derived from recent industry reports, such as Statista – Capacity of biggest global cement producers 2024 and Construction Kenya – Top 10 Largest Cement Producers. Note that there was a discrepancy in earlier data, with some sources listing CNBM’s capacity lower (e.g., 176.22 million metric tons), but the most recent Statista data (March 2025) confirms 530 million, suggesting updates in capacity or reporting methods.
Other notable producers include China Resources Cement Holdings (71 million metric tons, state-owned), Taiwan Cement Corporation (64 million metric tons, publicly traded), Eurocement (45 million metric tons, likely private with possible state ties in Russia), and Votorantim Cimentos (45 million metric tons, privately held by the Brazilian Votorantim Group).
Ownership Structures and State Influence
Ownership is a critical aspect, with significant variation across companies:
Mergers, Acquisitions, and Industry Dynamics
The cement industry has seen significant consolidation, affecting ownership and market share. For instance, Holcim was formed by the merger of Lafarge and Holcim in July 2015, creating one of the largest global players.
Similarly, Italcementi (Italy) became part of HeidelbergCement in 2016, expanding its global footprint.
Technological advancements, such as AI in supply chain optimization, are enhancing operational efficiency, with companies like Anhui Conch collaborating with Huawei on AI models for cement production.
These innovations are crucial for meeting growing demand, driven by infrastructure projects and government initiatives, particularly in Asia
Economic and Environmental Implications
Cement production is closely tied to economic growth, with demand often reflecting real estate and infrastructure activity.
However, the environmental impact is significant, with China’s cement industry criticized for pollution despite economic benefits.
Companies are responding with sustainability goals, such as Anhui Conch’s target to reduce emissions intensity by 6% by 2025 compared to 2020, aligning with China’s carbon peak and neutrality goals
Conclusion
In summary, no single entity produces or owns all the cement in the world; instead, the industry is dominated by a mix of state-owned enterprises (especially in China), publicly traded companies, and private firms. Chinese companies like CNBM (state-owned, 530 million metric tons/year) and Anhui Conch (state-influenced, 288 million metric tons/year) lead in capacity, followed by international players like Holcim (publicly traded, 274 million metric tons/year) and HeidelbergCement (publicly traded, 121 million metric tons/year). Ownership structures reflect national policies, with China’s state control contrasting with the public and private models in other regions. This diversity underscores the global and multifaceted nature of the cement industry as of May 31, 2025.
Key Citations
This post explores the world cement market, highlighting production by country, key producers’ capacities, and ownership details. Data is based on 2023-2024 figures and 2025 projections from sources like Statista, World Population Review, and IMARC Group.
| Company | Headquarters | Production Capacity (Million Metric Tons/Year, 2024) | Ownership |
|---|---|---|---|
| China National Building Material (CNBM) | China | 530 | State-owned |
| Anhui Conch Cement | China | 288 | Publicly listed, state-influenced |
| Holcim | Switzerland | 274 | Publicly traded |
| HeidelbergCement | Germany | 121 | Publicly traded |
| Cemex | Mexico | 87 | Publicly traded |
Market Insights:
PBOT Monolithic Curb + Sidewalk Concrete Calculator PBOT Monolithic Curb + SidewalkConcrete Volume Calculator Based on PBOT Std. Drawing P-551 (typical 4″ sidewalk + monolithic curb). Input sidewalk square footage from plans. Sidewalk Area (sq ft) – horizontal measured area: Sidewalk Slab Thickness (inches) – PBOT standard is usually 4″: Include Monolithic Curb Extra Volume?…
Volume Concrete – PBOT Monolithic Sidewalk + Curb Calculator PBOT Monolithic Sidewalk + Curb Concrete Calculator Estimate cubic yards for monolithic (integral) sidewalk with curb per PBOT standards (P-546 Keyed Combination Curb & Sidewalk, P-551 Sidewalks, P-540 Curbs). Select config for auto-filled cross-section area & dimensions. For Portland projects—verify with plans! Configuration (PBOT Typical): Standard…
🚧 Portland contractors: Need quick concrete volume estimates for PBOT-approved curb & gutter? Our free online calculator now includes presets based on the latest P-540 Curbs standards (updated 05/18/2022) from the Portland Bureau of Transportation. Volume Concrete – PBOT Curb & Ramp Calculator (P-540 / P-549 / P-550) PBOT Curb, Gutter & Ramp Concrete Calculator…

Washington State Concrete Contract Leads – January 9, 2026 Washington State Concrete Contract Leads – January 9, 2026 This internal report compiles open bids for Washington state contracts involving concrete work, construction, paving, repair, or related materials/services. Focus is on opportunities relevant to concrete supply, pouring, repair, or paving. Entries are sorted by category and…

Idaho State Concrete Contract Leads – January 9, 2026 Idaho State Concrete Contract Leads – January 9, 2026 This internal report compiles open bids for Idaho state contracts involving concrete work, construction, paving, repair, or related materials/services. Focus is on opportunities relevant to concrete supply, pouring, repair, or paving. Entries are sorted by category and…

Weekly Concrete Contract Leads Report – Week Ending January 9, 2026 Weekly Concrete Contract Leads Report – Week Ending January 9, 2026 Dear Volume Concrete Team, This is your internal weekly roundup of new and updated bid opportunities for concrete work, construction, paving, and related services in Oregon, with a focus on Portland. Curated from…

Daily Lead Gen: Local Construction Leads in Oregon Daily Lead Gen: Finding Local Construction Leads in Oregon Date: January 09, 2026 Guide for Volume Concrete to find state/local bids in Oregon/Portland. Focus on concrete-related projects (e.g., roads, infrastructure). Free to register on most sites. Why? Access state, city, metro contracts for construction work. Key Resources…

Daily Lead Generation Report: Guide to Acquiring a SAM.gov Account for Federal Concrete Contracts Daily Lead Generation Report: Comprehensive Guide to Acquiring a SAM.gov Account Date: January 09, 2026 This report provides a step-by-step HTML guide for registering on SAM.gov, essential for accessing federal contracts out for bid relevant to Volume Concrete (e.g., infrastructure, construction…

Comprehensive Interactive Guide to NAICS Codes for Construction: Focus on Concrete Industry DECLASSIFIED TOP SECRET // INTERNAL USE ONLY Comprehensive Interactive Guide to NAICS Codes for Construction: Focus on Concrete Industry Volume Concrete Team – Declassified for Internal Training Purposes Only! This redacted document provides an in-depth, interactive guide to NAICS codes relevant to our…
Key Points
Building the Backbone of Freedom – From Coast to Coast
As the land of the free and home of the brave, America has long stood as a beacon of innovation and resilience. Our concrete foundations power the world’s mightiest infrastructure – from the Golden Gate Bridge to the endless highways that connect our great nation. While global cement consumption tells a story of worldwide growth, it’s the American spirit that drives sustainable, high-quality production right here at home. At Volume Concrete, we’re proud to fuel America’s build with ready-mix excellence, supporting jobs, communities, and the American Dream.
Worldwide, cement remains the lifeblood of progress, with consumption stabilizing at approximately 4.15 billion metric tons in 2025 – a modest 1-2% recovery from 2024’s 4.2 billion tons (excluding China’s fluctuations). This growth, valued at over $410 billion, is propelled by urbanization in Asia and Africa, but America’s efficient, eco-conscious production sets the global standard.
Emissions challenge remains: Cement accounts for 4-8% of global CO2, but U.S. innovations in low-carbon mixes (like Type IL) are leading the green revolution.
In 2025, U.S. new construction starts reflect our unbreakable drive: 1.31 million annualized housing units in August alone, with single-family homes at 890,000 – down slightly from peaks but steady amid economic headwinds. Total authorizations hit ~1.5 million units in 2024, aligning with pre-2008 norms, yet we’re tackling a 2.5-5.5 million unit housing shortfall through bold projects.
Cement consumption? A resilient ~100 million tons projected for 2025 (down 1.6% from 2024’s dip), but market value surges to $15.22 billion at 4.5% growth. Nonresidential sectors like highways (+11% in Q4 2024) shine, fueled by federal investments.
| Sector | 2025 Starts/Consumption (Est.) | Key American Wins |
|---|---|---|
| Single-Family Housing | ~950,000 units | Reviving the suburbs – family homes for the next generation |
| Multifamily | 316,000 units (5+) | Urban renewal: Affordable living in red, white, and blue cities |
| Nonresidential (Data Centers) | 1M tons cement by 2028 | AI powerhouse: 6,000 centers by 2027, securing U.S. tech dominance |
| Infrastructure (Highways/Bridges) | +11% growth | IIJA legacy: Rebuilding America, one mile at a time |
Looking ahead, the stars and stripes wave high for U.S. construction. Total spending climbs to $1.26 trillion in 2026 (+4%), with nonresidential buildings up 3% and infrastructure at +4.1%. By 2030, North American cement volume hits 252 million tons (4.42% CAGR), market value $26 billion – driven by AI data centers (5x historic levels), renewable energy (+6.5%), and healthcare modernizations.
Challenges? Labor shortages (439,000 gap in 2026) and costs – but American ingenuity prevails. We’re not just building structures; we’re forging the future.
Disclaimer: Data sourced from USGS, Statista, ACA, Census Bureau, Deloitte, and industry forecasts (as of Dec 2025). Estimates vary; actuals depend on policy, economy, and innovation. For project-specific needs, consult Volume Concrete – America’s trusted partner.
🇺🇸 Built Strong, Built Proud – Volume Concrete
Cement is a vital material in construction, forming the basis of concrete used in buildings, roads, and infrastructure worldwide. Its consumption reflects economic activity, particularly in developing regions undergoing rapid urbanization. This article explores global cement consumption trends, highlighting its growth, geographical distribution, environmental impact, and future outlook, aiming to provide a comprehensive understanding for readers interested in construction and sustainability.
Historical Context
Global cement consumption has seen exponential growth over decades. In 1995, production was around 1.39 billion metric tons, rising to 4.1 billion metric tons by 2023, a nearly threefold increase. This growth is largely driven by Asia, with China’s production surging 100-fold from 1970 to 2020 due to massive infrastructure projects. Outside China, production grew 3.2 times over the same period, reflecting global urbanization trends.
Geographical Insights
China leads global cement consumption, accounting for 51.6% of production in 2022, translating to about 2.1 billion metric tons in 2023. India follows with 9.5% (around 400 million metric tons), and the EU27 at 4.3%. Other notable consumers include the US (2.3%), Vietnam, Turkey, and Indonesia. This distribution shows a shift from OECD countries, which saw their share drop from 64% in 1970 to 12% in 2020, to emerging economies in Asia and Africa, projected to dominate future demand.
Driving Factors
Several factors fuel cement consumption:
These drivers are particularly strong in regions like Africa, where population growth is expected to make it the largest cement producer by century’s end, despite lower per capita demand.
Environmental Concerns
The cement industry significantly impacts the environment, contributing 4-8% of global CO2 emissions. This arises from calcination (releasing CO2 from limestone) and energy use, often fossil fuel-based. In 2023, emissions were around 2.4 billion metric tons, with China contributing the most. Other impacts include air pollution, water usage, and land disruption from quarrying, exacerbating urban heat islands and runoff issues in cities.
Industry and Market Dynamics
The cement market is fragmented, with leaders like LafargeHolcim, Anhui Conch Cement, and China National Building Material Company. Only 2.6% of cement is traded globally, indicating local consumption dominance. Challenges include overcapacity in China and a push for sustainability, with companies investing in carbon capture and alternative fuels to meet regulatory pressures.
Future Outlook
Global cement consumption is projected to grow 12-23% by 2050, with demand outside China and OECD rising from 30% today to 56% by 2050 and 84% by 2100. Sustainability efforts include low-carbon cements, energy efficiency, and recycling, aiming to reduce the industry’s carbon footprint while meeting infrastructure needs. Balancing growth with environmental goals will be crucial as urbanization continues.
Worldwide Cement Consumption: An In-Depth Survey Note
Cement, a fundamental component of concrete, is indispensable for global construction, underpinning infrastructure, housing, and urban development. This survey note provides a detailed examination of worldwide cement consumption, covering historical trends, geographical distribution, influencing factors, environmental impacts, industry dynamics, and future projections, based on recent data and analyses as of May 2025.
Historical Trends and Statistics
Global cement consumption has experienced significant growth over the past decades, reflecting the expansion of construction activities worldwide. Historical data indicates that in 1995, global cement production was approximately 1.39 billion metric tons, escalating to an estimated 4.1 billion metric tons by 2023, according to Statista – Global cement production. This nearly threefold increase highlights the industry’s response to urbanization and economic development.
Key historical trends include:
Specific consumption figures, such as 2020’s global consumption contracting by 0.2% to 4,143.7 million metric tons, are detailed in Uncertain times from International Cement Review, with China alone consuming 2,377.68 million metric tons, or 57% of the global total.
Geographical Distribution
Cement consumption is closely aligned with production due to the material’s low trade volume (only 2.6% globally traded, per Rhodium Group). The geographical distribution is as follows:
This distribution underscores the shift from industrialized regions to emerging economies, driven by urbanization and population growth.
Factors Influencing Consumption
Several factors drive global cement consumption, as identified in various analyses:
These factors are particularly pronounced in regions undergoing rapid development, such as Asia and Africa.
Environmental Impact
The cement industry’s environmental impact is substantial, primarily due to its high energy consumption and CO2 emissions, as detailed in multiple sources:
Efforts to mitigate these impacts include alternative fuels, carbon capture and storage (CCS), and developing low-carbon cement technologies, as discussed in Cut Carbon and Toxic Pollution, Make Cement Clean and Green – NRDC.
Industry and Market Analysis
The global cement industry is highly fragmented, with numerous players ranging from small local producers to large multinationals. Key dynamics include:
The industry is influenced by government regulations, particularly those aimed at reducing CO2 emissions and promoting sustainable construction practices.
Future Projections and Sustainability
Future projections indicate continued growth in global cement consumption, driven by urbanization and infrastructure needs in developing regions. Key projections include:
Balancing growth with environmental goals will be crucial as urbanization continues, with the industry playing a pivotal role in shaping the global built environment.
Conclusion
Worldwide cement consumption is a critical aspect of global economic and societal development, reflecting the world’s growing need for infrastructure, housing, and urbanization. Historically dominated by China and India, future growth is expected to shift towards Africa and other developing regions. While cement is indispensable, its production contributes significantly to global CO2 emissions (4-8%) and other environmental issues. The industry must balance its role in supporting development with sustainability, through innovation, policy changes, and greener technologies, to ensure a sustainable future as the world continues to urbanize and develop.
Key Citations
Key Points
Geopolymer cements are sustainable alternatives to traditional Portland cement, leveraging waste materials like fly ash and slag to create low-carbon binders. They show promise in reducing environmental impact and enhancing construction durability, but challenges like curing requirements and standardization need addressing.
Environmental Benefits
Geopolymer cements can cut CO2 emissions significantly, using industrial byproducts to minimize waste and conserve resources, making them eco-friendly for construction.
Performance and Applications
They likely offer superior strength and resistance to fire and chemicals, ideal for precast elements, bridges, and even innovative uses like water filtration, expanding their utility in modern building.
Challenges
However, the lack of standardized methods and high curing needs pose hurdles, with ongoing research aiming to improve accessibility and long-term data.
Survey Note: Detailed Analysis of Geopolymer Cement Alternatives
Geopolymer cements represent a transformative approach to sustainable construction, offering low-carbon alternatives to traditional Portland cement. This analysis, as of May 29, 2025, explores their composition, environmental benefits, mechanical properties, applications, challenges, and future prospects, drawing from recent insights and industry trends. It builds on the narrative of sustainable cement alternatives, particularly in relation to limestone-based cements, and positions geopolymer cements as a critical component in decarbonizing the construction sector.
Definition and Composition
Geopolymer cements are inorganic polymers formed through the geopolymerization process, which involves the reaction of aluminosilicate materials with alkali activators. The resulting structure consists of semi-crystalline or amorphous three-dimensional networks of [SiO4]4- and [AlO4]5- tetrahedra. Key source materials include:
Alkali activators, such as sodium hydroxide (NaOH), potassium hydroxide (KOH), sodium silicate (Na2SiO3), or potassium silicate (K2SiO3), initiate the reaction by dissolving the aluminosilicate phases, followed by reorganization, condensation, and polymerization to form a solid binder. This process contrasts with Portland cement, which relies on calcium silicate hydration and involves high-temperature calcination of limestone, making geopolymers a lower-energy alternative.
Environmental Benefits
The environmental advantage of geopolymer cements is significant, driven by their reduced carbon footprint and resource efficiency. Research, as cited in Geopolymer Concrete: A Sustainable Alternative to Portland Cement, suggests geopolymer concrete can reduce embodied carbon by up to 80% compared to ordinary Portland cement (OPC) concrete. This is primarily because geopolymerization does not require limestone calcination, a process that emits approximately 0.8 to 1 ton of CO2 per ton of cement in Portland cement production, as noted in Geopolymer: A cheaper, greener alternative for cement. The CO2 footprint of geopolymer concrete is estimated to be 9% less than concrete containing 100% OPC, per Geopolymers as an alternative to Portland cement: An overview.
Moreover, geopolymer cements utilize industrial byproducts, contributing to a circular economy by valorizing waste materials. This reduces the environmental burden of waste disposal and conserves natural resources, aligning with global sustainability goals. The global annual cement production, expected to reach 5.9 billion tons by 2020, generates over 4.8 billion tons of CO2, highlighting the urgency of such alternatives, as per Geopolymers as an alternative to Portland cement: An overview.
Mechanical Properties and Performance
Geopolymer cements exhibit mechanical properties that are often superior to Portland cement, enhancing their suitability for construction. Studies indicate higher compressive strength, particularly in the early stages, due to rapid polymerization. For instance, Geopolymer Concrete: A Sustainable Alternative to Portland Cement notes that geopolymer paste achieves higher compressive strength than OPC paste at 3 days, with strength increasing over time due to continuous polymerization and condensation. Geopolymer: A cheaper, greener alternative for cement adds that geopolymer is twice as strong in compression and three times as strong in flexure, with the ability to set within one day.
Durability is another strength, with geopolymer concrete showing excellent resistance to chemical attacks (e.g., sulfates, acids), freeze-thaw cycles, and fire. Its dense microstructure and low permeability make it ideal for harsh environments, such as marine settings or industrial facilities, as detailed in Geopolymers as an alternative to Portland cement: An overview. This durability, combined with lower corrosion rates for reinforced steel bars, extends the lifespan of structures, enhancing long-term sustainability.
Advantages and Applications
Geopolymer cements offer a range of advantages, expanding their potential applications. Key benefits include:
Applications include:
Challenges and Limitations
Despite these benefits, geopolymer cements face several challenges that limit widespread adoption. Key issues include:
These challenges highlight the need for continued research to address technical and regulatory barriers.
Future Prospects
The future of geopolymer cements is promising, with research focused on overcoming limitations and expanding applications. Key areas include:
As of May 29, 2025, geopolymer cements are gaining traction in niche markets, with potential to capture a significant share of the global cement market by 2030, especially if supported by policy and technological advancements.
Summary Table: Geopolymer Cement Alternatives
| Type | Key Materials | Emission Reduction | Strength/Durability | Challenges |
|---|---|---|---|---|
| Fly Ash-Based | Fly ash, alkali activators | Up to 80% | High compressive, durable | Declining fly ash availability |
| Slag-Based | Blast furnace slag, alkali activators | 50-70% | Excellent durability | Limited slag supply, high costs |
| Metakaolin-Based | Metakaolin, alkali activators | 40-60% | High strength | High cost, energy-intensive |
| Calcined Clay-Based | Calcined clay, alkali activators | 30-40% | Good resistance | Calcination control, standardization |
This table encapsulates the key alternatives, providing a quick reference for stakeholders in construction.
Expert Insights
Experts like Trudy Kriven, as cited in Geopolymer: A cheaper, greener alternative for cement, emphasize geopolymer’s potential to reduce global CO2 emissions, particularly in large-scale construction projects. This aligns with global efforts to decarbonize, with geopolymer cements seen as a practical step forward.
In conclusion, geopolymer cement alternatives are well-supported by their environmental benefits, performance enhancements, and growing applications. As of May 29, 2025, their adoption is shaping a more sustainable future for the construction industry, balancing performance with ecological responsibility.
Key Citations
Concept: Limestone Calcined Clay Cement (LC3) combines limestone with calcined clay to create a low-carbon alternative to traditional Portland cement. It leverages limestone’s benefits while incorporating clay’s pozzolanic properties to further reduce clinker content and emissions.
2. Carbon Capture and Utilization (CCU) with Limestone in Cement
Concept: Limestone can be integrated into carbon capture and utilization processes, where CO₂ from cement production is captured and mineralized into limestone-like compounds or used to enhance concrete curing, further reducing the industry’s carbon footprint.
3. Limestone’s Role in Geopolymer and Alternative Binders
Concept: Limestone can be used in geopolymer cements or alkali-activated materials, which are low-carbon alternatives to Portland cement. These binders use industrial byproducts like fly ash or slag, with limestone as a filler or activator.
4. Regional and Geological Variations in Limestone Quality
Concept: The quality and composition of limestone vary by region, affecting its suitability for cement production. Exploring these variations can highlight optimization strategies and regional adoption trends.=
5. Limestone in 3D-Printed Concrete and Smart Construction
Concept: Limestone’s fine particle size and reactivity make it suitable for 3D-printed concrete, an emerging construction technology. It can enhance printability and sustainability in automated building processes.
6. Socioeconomic Impacts of Limestone Mining for Cement
Concept: Limestone mining for cement production has socioeconomic implications, including job creation, environmental concerns, and community impacts. Addressing these adds a human dimension to the narrative
7. Policy and Regulatory Drivers for Limestone-Based Cements
Concept: Government policies and international standards are accelerating the adoption of limestone-based cements like PLC and LC3, driven by climate goals and building codes.
8. Limestone’s Role in Circular Construction Practices
Concept: Limestone can support circular construction by enabling the recycling of concrete, where crushed concrete is reused as a limestone-rich aggregate or raw material for new cement.
| Aspect | Details |
|---|---|
| Primary Use | Key raw material for clinker (80-90% of kiln feed), providing calcium for binding. |
| Admixture Role | Used in PLC (5-15% limestone) and LC3 (with calcined clay), enhancing sustainability. |
| Carbon Footprint Reduction | PLC reduces emissions by ~10%; LC3 up to 30-40%; CCU adds 5-10% via CO₂ mineralization. |
| Performance Benefits | Improves particle distribution, reactivity, and durability; ideal for 3D printing and geopolymers. |
| Cost Benefits | Often less expensive; recycled limestone from concrete supports circular economy savings. |
| Industry Adoption | 40% U.S. market share for PLC; LC3 growing in developing nations; policy drives adoption. |
| Socioeconomic Impact | Supports jobs but requires sustainable mining to mitigate environmental and community concerns. |
Key Citations (Reused and New)
These additional ideas enrich the narrative by connecting limestone’s role to cutting-edge innovations, socioeconomic realities, and global policy trends, positioning it as a linchpin in the cement industry’s sustainable future.
Key Points
Limestone plays a crucial role in cement, acting as both a primary ingredient and an additive that boosts sustainability. It provides the calcium needed for cement to bind materials together, forming the basis of concrete. Modern uses, like in Portland-Limestone Cement (PLC), show it can reduce environmental impact and improve cement qualities, making it a popular choice in construction.
Benefits in Cement
Limestone is essential, making up 80-90% of the raw materials for cement clinker, the core of cement production. In PLC, it’s added at 5-15%, helping lower the carbon footprint by replacing energy-intensive clinker. This makes cement production greener, with studies suggesting a 10% reduction in emissions. It also seems to enhance cement’s performance, such as better particle distribution and resistance to environmental wear.
Industry Adoption
The construction industry is increasingly adopting PLC, approved by many state transport departments as an eco-friendly option. It’s often cheaper, depending on the region, and performs similarly or better in tests like freeze-thaw resistance, making it a practical choice for sustainable building.
Survey Note: Detailed Analysis of Limestone in Cement Production
Limestone’s role in cement production is multifaceted, serving as both a foundational raw material and a strategic admixture that enhances the sustainability and performance of cement. This detailed analysis explores its chemical contributions, environmental benefits, and growing adoption in the construction industry, drawing from recent insights and industry trends as of May 29, 2025.
Chemical and Structural Role
Limestone, primarily composed of calcium carbonate (CaCO₃), is the backbone of cement manufacturing. It provides the calcium oxide (CaO) essential for the chemical reactions that enable cement to bind aggregates in concrete. According to Fote Machinery, limestone constitutes 80-90% of the kiln feed used to produce cement clinker, the intermediate product ground to make cement. This calcium is derived from the fossilized shells and skeletons of prehistoric sea creatures, as noted in the same source, highlighting its natural origin and suitability for industrial use.
In addition to its role as a raw material, limestone is increasingly used as an admixture in Portland-Limestone Cement (PLC), also known as Type 1L cement. CarbonCure Technologies details that PLC contains 5-15% limestone, integrated after the clinker is cooled and then finely ground. This process, as explained by Concrete Construction Magazine, results in a cement with improved particle size distribution, as limestone grinds more easily than clinker, potentially reducing energy use in production.
Environmental and Sustainability Benefits
The inclusion of limestone in cement, particularly in PLC, is driven by its environmental benefits. Research, as cited by CarbonCure Technologies, suggests that PLC can reduce the carbon footprint of cement by approximately 10% compared to traditional Portland cement. This reduction is achieved by replacing a portion of the energy-intensive clinker with limestone, which requires less processing and does not undergo calcination, thus emitting fewer greenhouse gases. PROSOCO further notes that this approach was developed to address the significant CO₂ emissions from cement production, estimated at 7-8% of global emissions, aligning with efforts to meet climate goals like the Paris Agreement.
The sustainability benefits extend to the concrete mix, where limestone’s finer grinding leads to denser particle packing, as mentioned in CarbonCure Technologies. This contributes to lower carbon ingredients overall, enhancing the eco-friendliness of concrete infrastructure. The Global Cement and Concrete Association adds that limestone, once considered an inert filler, is now recognized as a supplementary cementitious material, contributing to how concrete hardens and potentially reducing the need for other high-emission additives.
Performance Enhancements
Limestone’s addition to cement not only aids sustainability but also improves performance. Fote Machinery highlights that PLC performs equivalently to ordinary cement in critical areas such as shrinkage, permeability, freeze-thaw resistance, and salt scaling, with slight enhancements in some cases. This is attributed to limestone acting as a seed crystal, better distributing reaction products and increasing cement reactivity, as noted in Concrete Construction Magazine. The finer particle size also potentially reduces water demand, improving the efficiency of water reducers in concrete mixes.
Cost and Economic Considerations
Economically, limestone use in cement can be advantageous. CarbonCure Technologies and Precast/Prestressed Concrete Institute suggest that PLC is often less expensive than traditional cement, depending on regional availability and costs. Limestone’s abundance, with significant reserves noted in LinkedIn, such as Karnataka holding 27% of India’s resources, supports its cost-effectiveness. This economic benefit, combined with performance parity, makes PLC an attractive option for cost-conscious builders.
Industry Adoption and Trends
The adoption of limestone-enhanced cements, particularly PLC, is on the rise. CarbonCure Technologies reports increasing use by concrete producers, especially those leveraging CarbonCure’s technologies for stackable sustainability benefits. The National Plasterers Council indicates that limestone cement now holds an estimated 40% of the U.S. market, up from its introduction in the early 2010s, driven by a push to reduce greenhouse gases. Many state Departments of Transportation have approved PLC as an eco-friendly alternative, as mentioned in CarbonCure Technologies, reflecting its integration into mainstream construction practices.
Historical context, as provided by Precast/Prestressed Concrete Institute, traces PLC’s development to the 1960s in Europe, with significant adoption following the 1973 oil crisis, particularly in France, due to limited alternative supplementary cementitious materials. This trend continues, with ACEEE evaluating potential carbon reduction at various adoption rates, underscoring limestone’s role in decarbonizing the cement sector.
Challenges and Considerations
While the benefits are clear, there are considerations. Shelly Company notes that concrete and mortar made with limestone can react with carbon dioxide in rainwater, leading to wear over time, though this is a common challenge in concrete durability. Acid-based cleaning chemicals and increased rain acidity from burning fossil fuels can exacerbate this, requiring maintenance. However, these issues are manageable with proper design and maintenance, and the overall benefits often outweigh these challenges.
Summary Table: Beneficial Uses of Limestone in Cement
| Aspect | Details |
|---|---|
| Primary Use | Key raw material for cement clinker (80-90% of kiln feed), providing calcium for binding. |
| Admixture Role | Used in PLC (5-15% limestone), enhancing sustainability and performance. |
| Carbon Footprint Reduction | Reduces emissions by ~10% by replacing clinker, aligning with climate goals. |
| Performance Benefits | Improves particle distribution, reactivity, and resistance to shrinkage, permeability, etc. |
| Cost Benefits | Often less expensive, depending on region, due to abundant limestone resources. |
| Industry Adoption | Increasingly used, with 40% U.S. market share, approved by many DOTs for eco-friendliness. |
This table encapsulates the multifaceted benefits, providing a quick reference for stakeholders in cement and construction.
Expert Insights
Experts like Dr. Doug Hooton, as cited in CarbonCure Technologies and CarbonCure Technologies, emphasize PLC’s role in reducing greenhouse gas emissions, particularly in concrete infrastructure. This aligns with global efforts to decarbonize, with limestone’s integration seen as a practical step forward.
In conclusion, limestone’s beneficial use in cement is well-supported by its chemical contributions, environmental advantages, and economic viability. As of May 29, 2025, its adoption in PLC and other forms is shaping a more sustainable future for the construction industry, balancing performance with ecological responsibility.
Key Citations

