Category: Tutorials

  • The History of Concrete in the Pacific Northwest Part 6 of 6 Series – Today’s Innovations and the Future of Sustainable Concrete

    The History of Concrete in the Pacific Northwest Part 6 of 6 Series – Today’s Innovations and the Future of Sustainable Concrete

    History of Concrete in the Pacific Northwest – Part 6 (Final)

    History of Concrete in the Pacific Northwest – Part 6 (Final): Toward a Sustainable Future – Low-Carbon Innovations and Reconciling Legacy Impacts

    As the Pacific Northwest confronts climate change and the long-term environmental costs of its concrete-intensive past, the industry is pivoting toward groundbreaking low- and zero-carbon technologies. From new regional manufacturing hubs to cement-free binders and carbon-sequestering mixes, innovators are reducing concrete’s massive carbon footprint—responsible for about 8% of global CO₂ emissions—while addressing the ecological legacy of historic mega-dams through unprecedented removal projects.

    Regional Leadership in Low-Carbon Cement Production

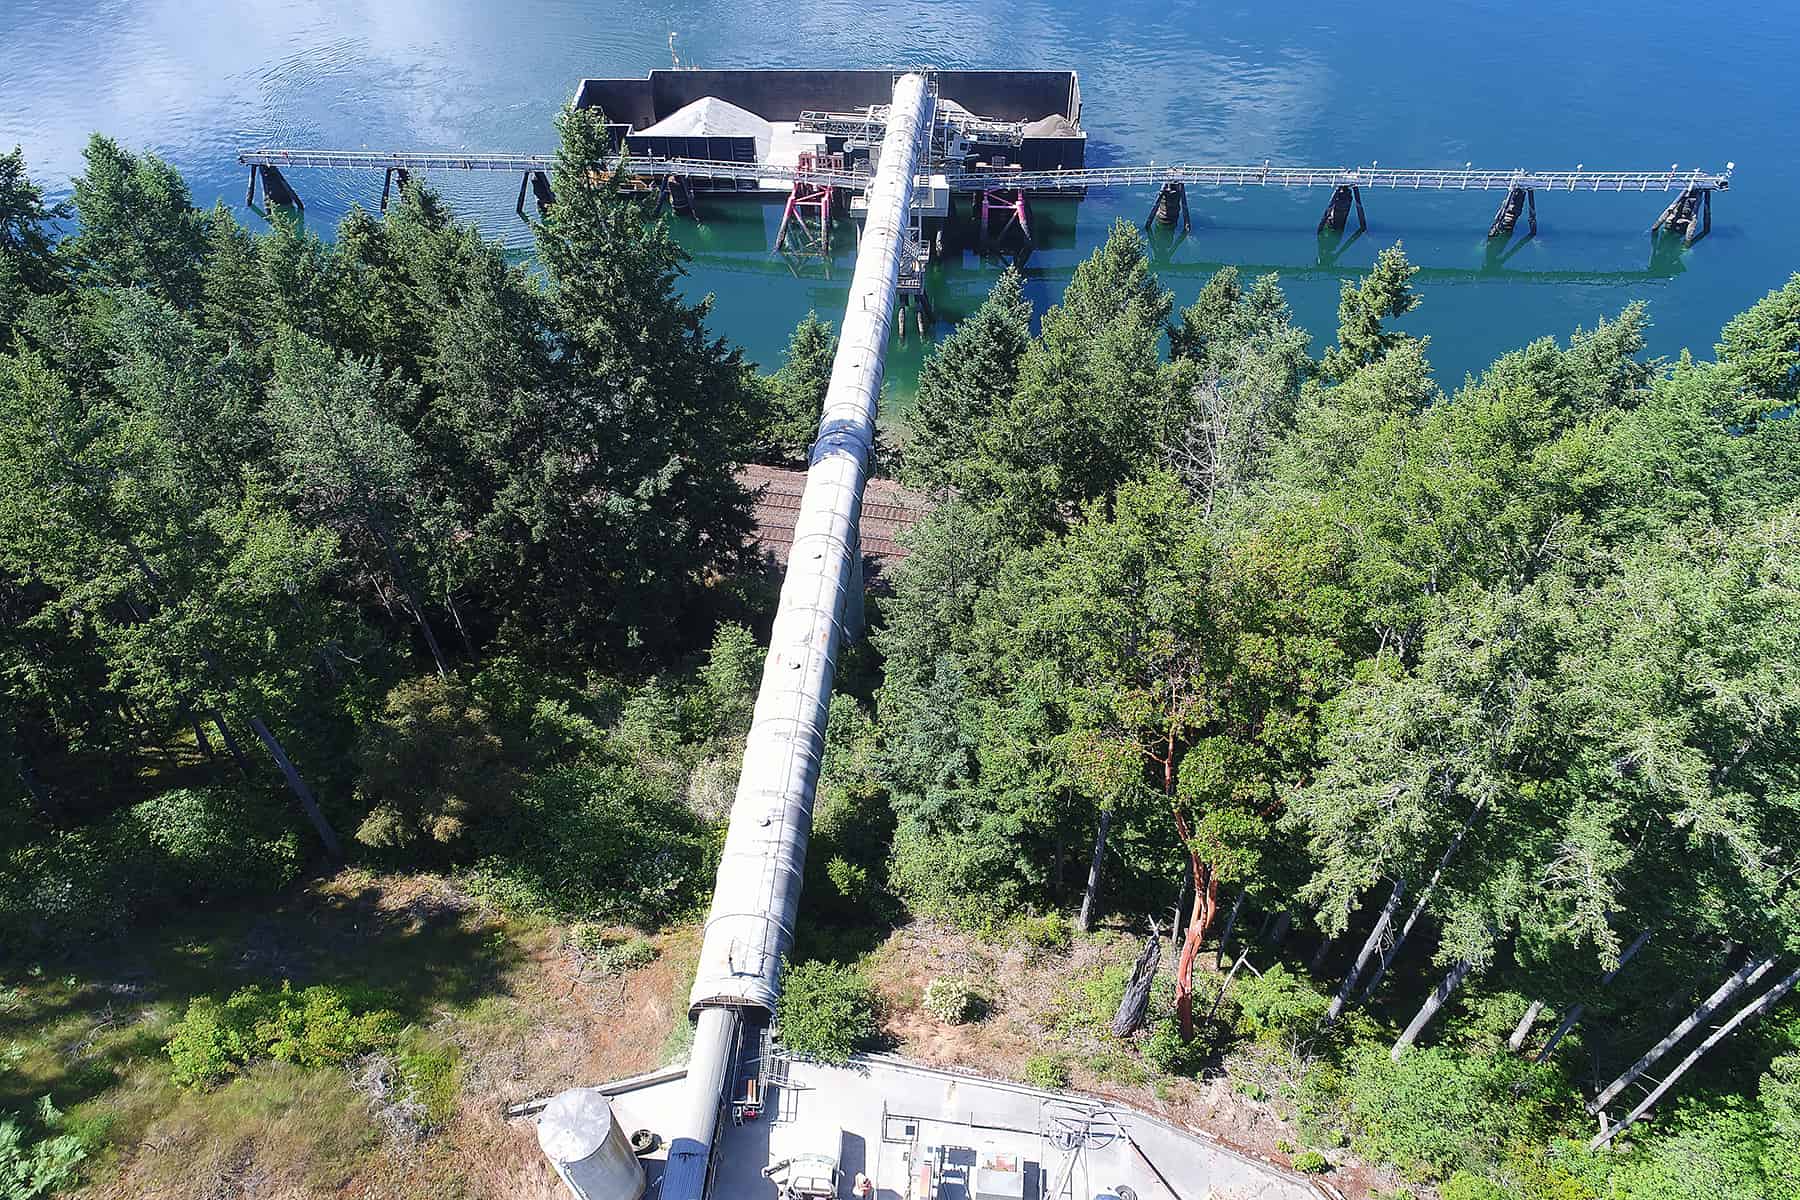
    In July 2025, Eco Material Technologies opened its Lakeview Plant in southern Oregon, the company’s first sustainably built manufacturing hub in the Pacific Northwest. This facility produces up to 300,000 tons annually of supplementary cementitious materials (SCMs) and proprietary green cement blends using local resources like perlite. By replacing 25–100% of traditional Portland cement, these alternatives can cut the carbon footprint of concrete’s cement portion by up to 80%.

    Eco Material Technologies Lakeview Plant exterior

    Exterior view of the new Eco Material Technologies Lakeview Plant in southern Oregon

    Eco Material Lakeview Plant operations

    Operations at the Lakeview Plant, producing low-carbon cement alternatives

    The plant creates local jobs and leverages rail for efficient distribution, marking a major step in domestic low-carbon material supply for PNW construction.

    Cement-Free and Carbon-Negative Breakthroughs

    Seattle-based C-Crete Technologies has pioneered cement-free concrete using natural minerals, industrial by-products, and novel binders like basalt and zeolite. Debuted in Seattle buildings since 2023, these mixes achieve full Portland cement replacement, preventing roughly 1 ton of CO₂ per ton of binder while meeting or exceeding ASTM standards for strength and durability.

    Sustainable concrete pouring on construction site

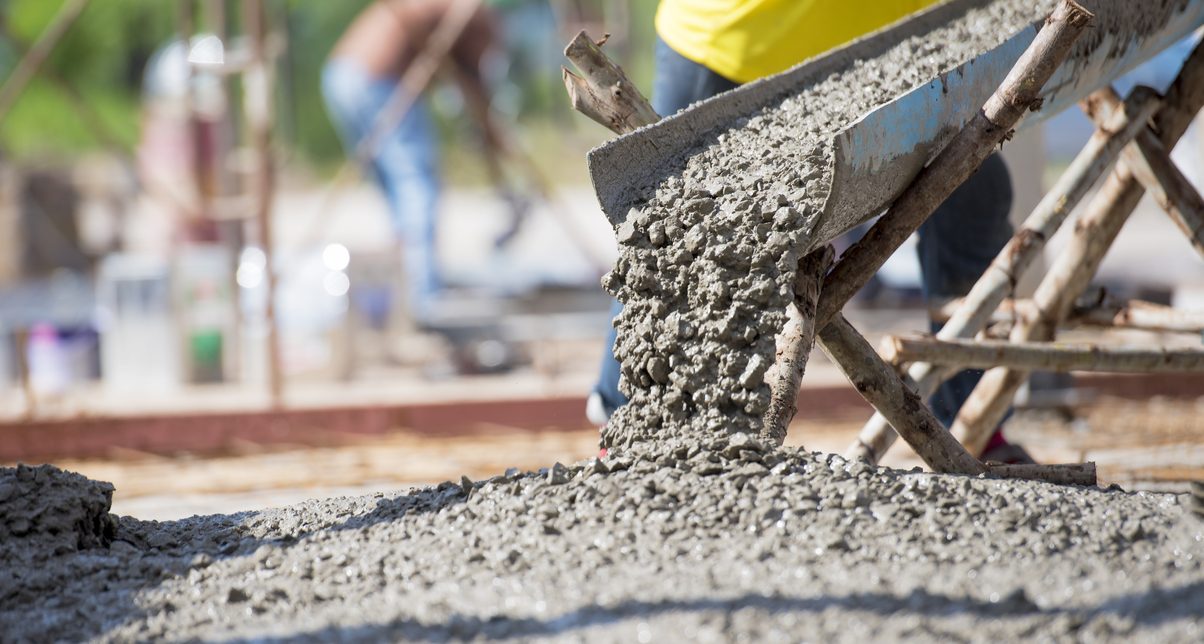
    Pouring low-carbon concrete at a construction site

    Sustainable concrete mixing

    Innovative sustainable concrete mix in production

    Other advancements include carbon mineralization technologies that inject CO₂ into fresh concrete for permanent sequestration and strength gains, as well as emerging enzymatic and bio-inspired materials that turn concrete into a potential carbon sink.

    Carbon sequestration process in concrete

    Illustration of carbon sequestration in cementitious materials

    Carbon capture technology for concrete

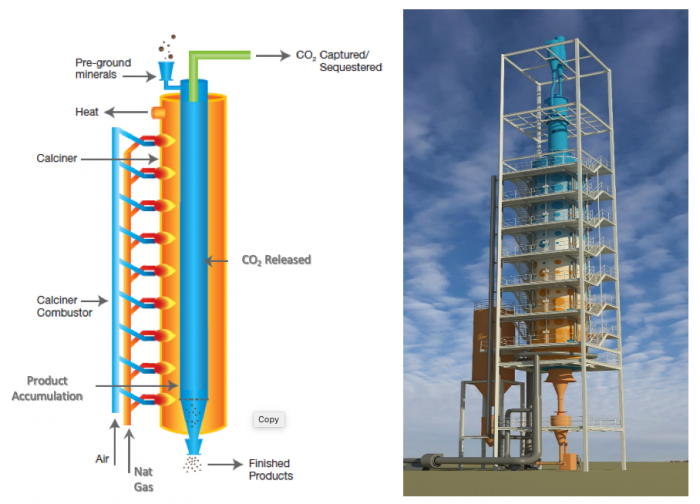
    Carbon capture and utilization in cement production

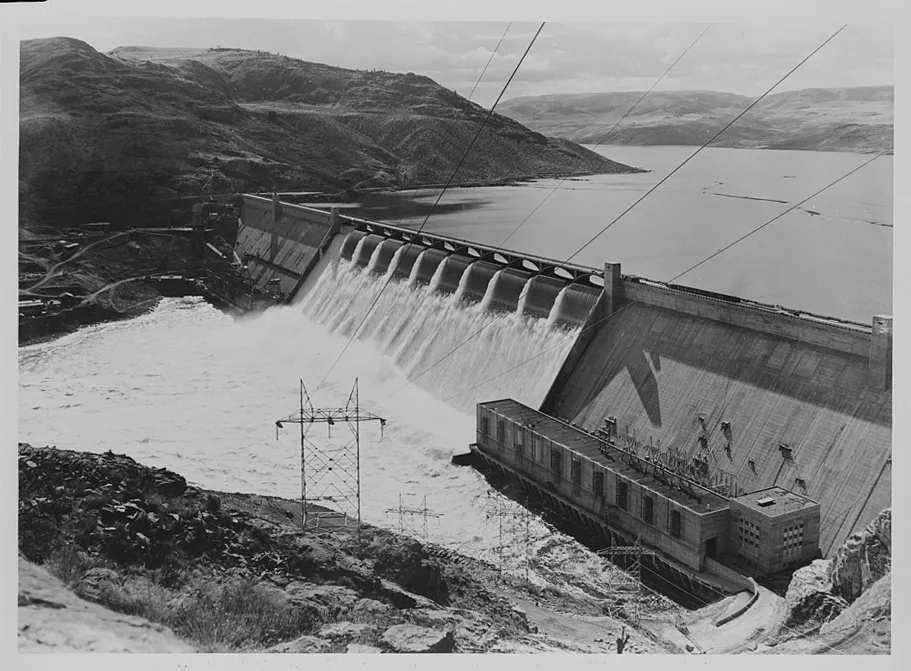
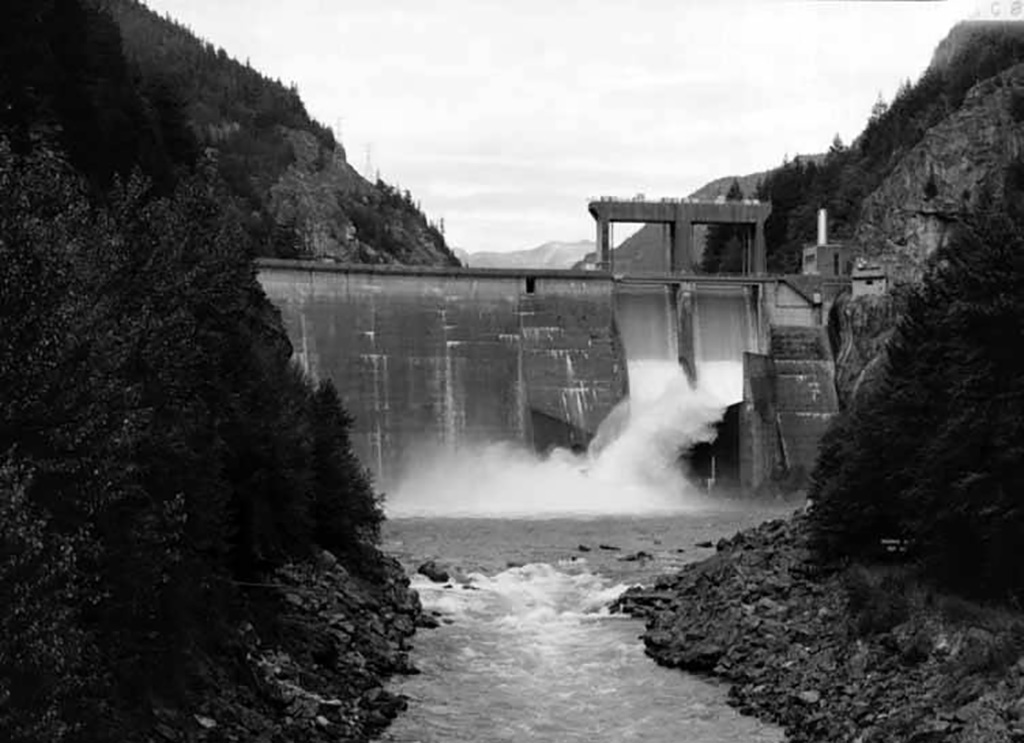
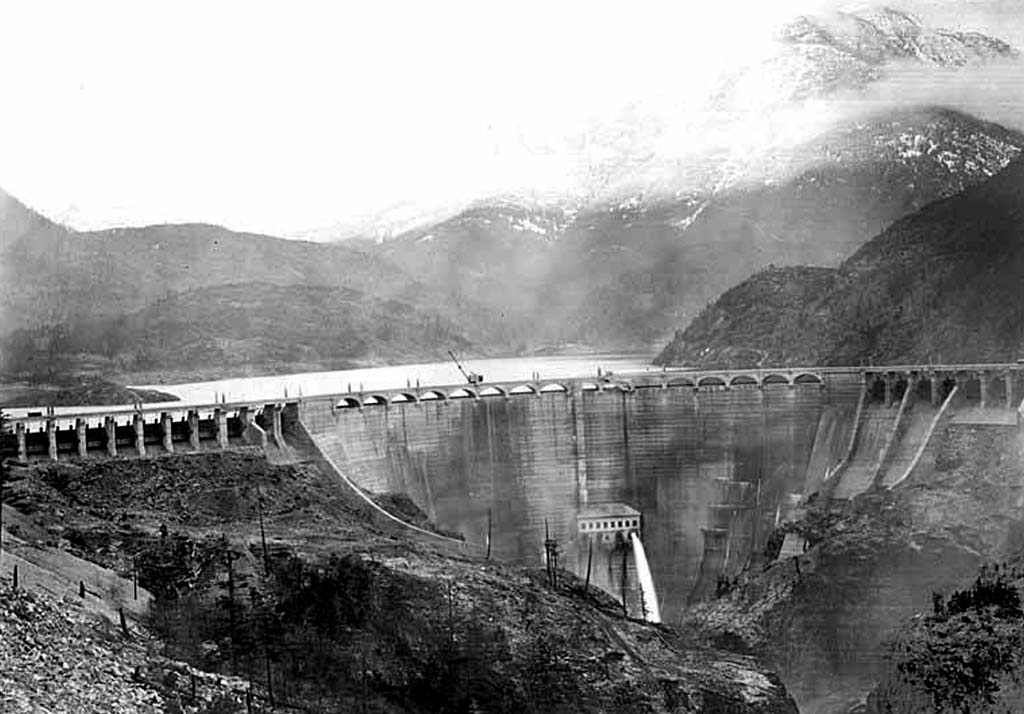
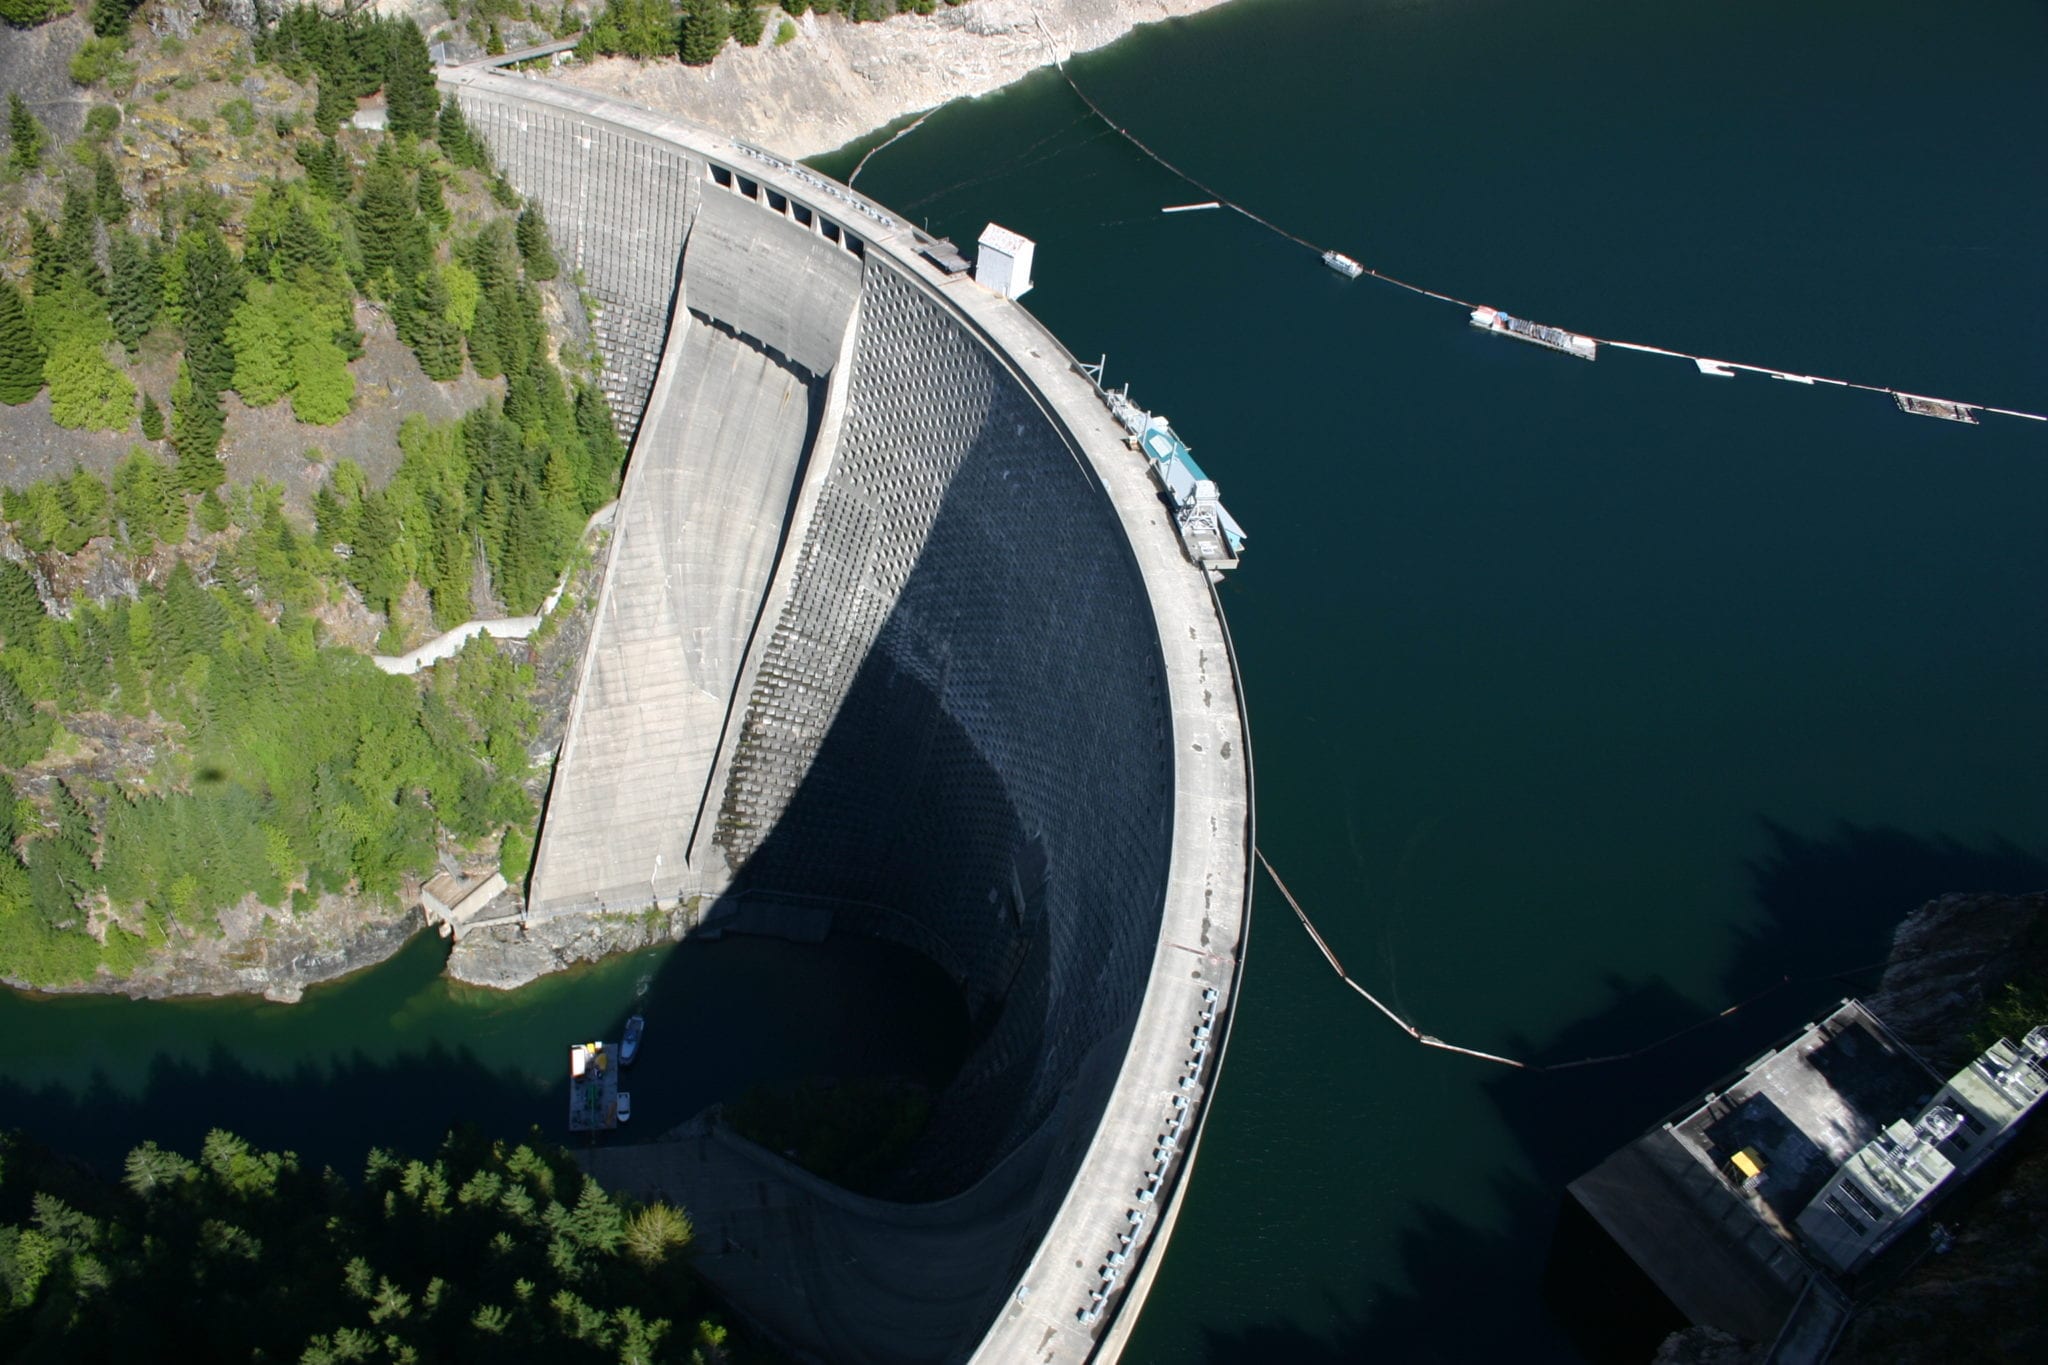
    Reconciling the Legacy: Dam Removals and Ecosystem Restoration

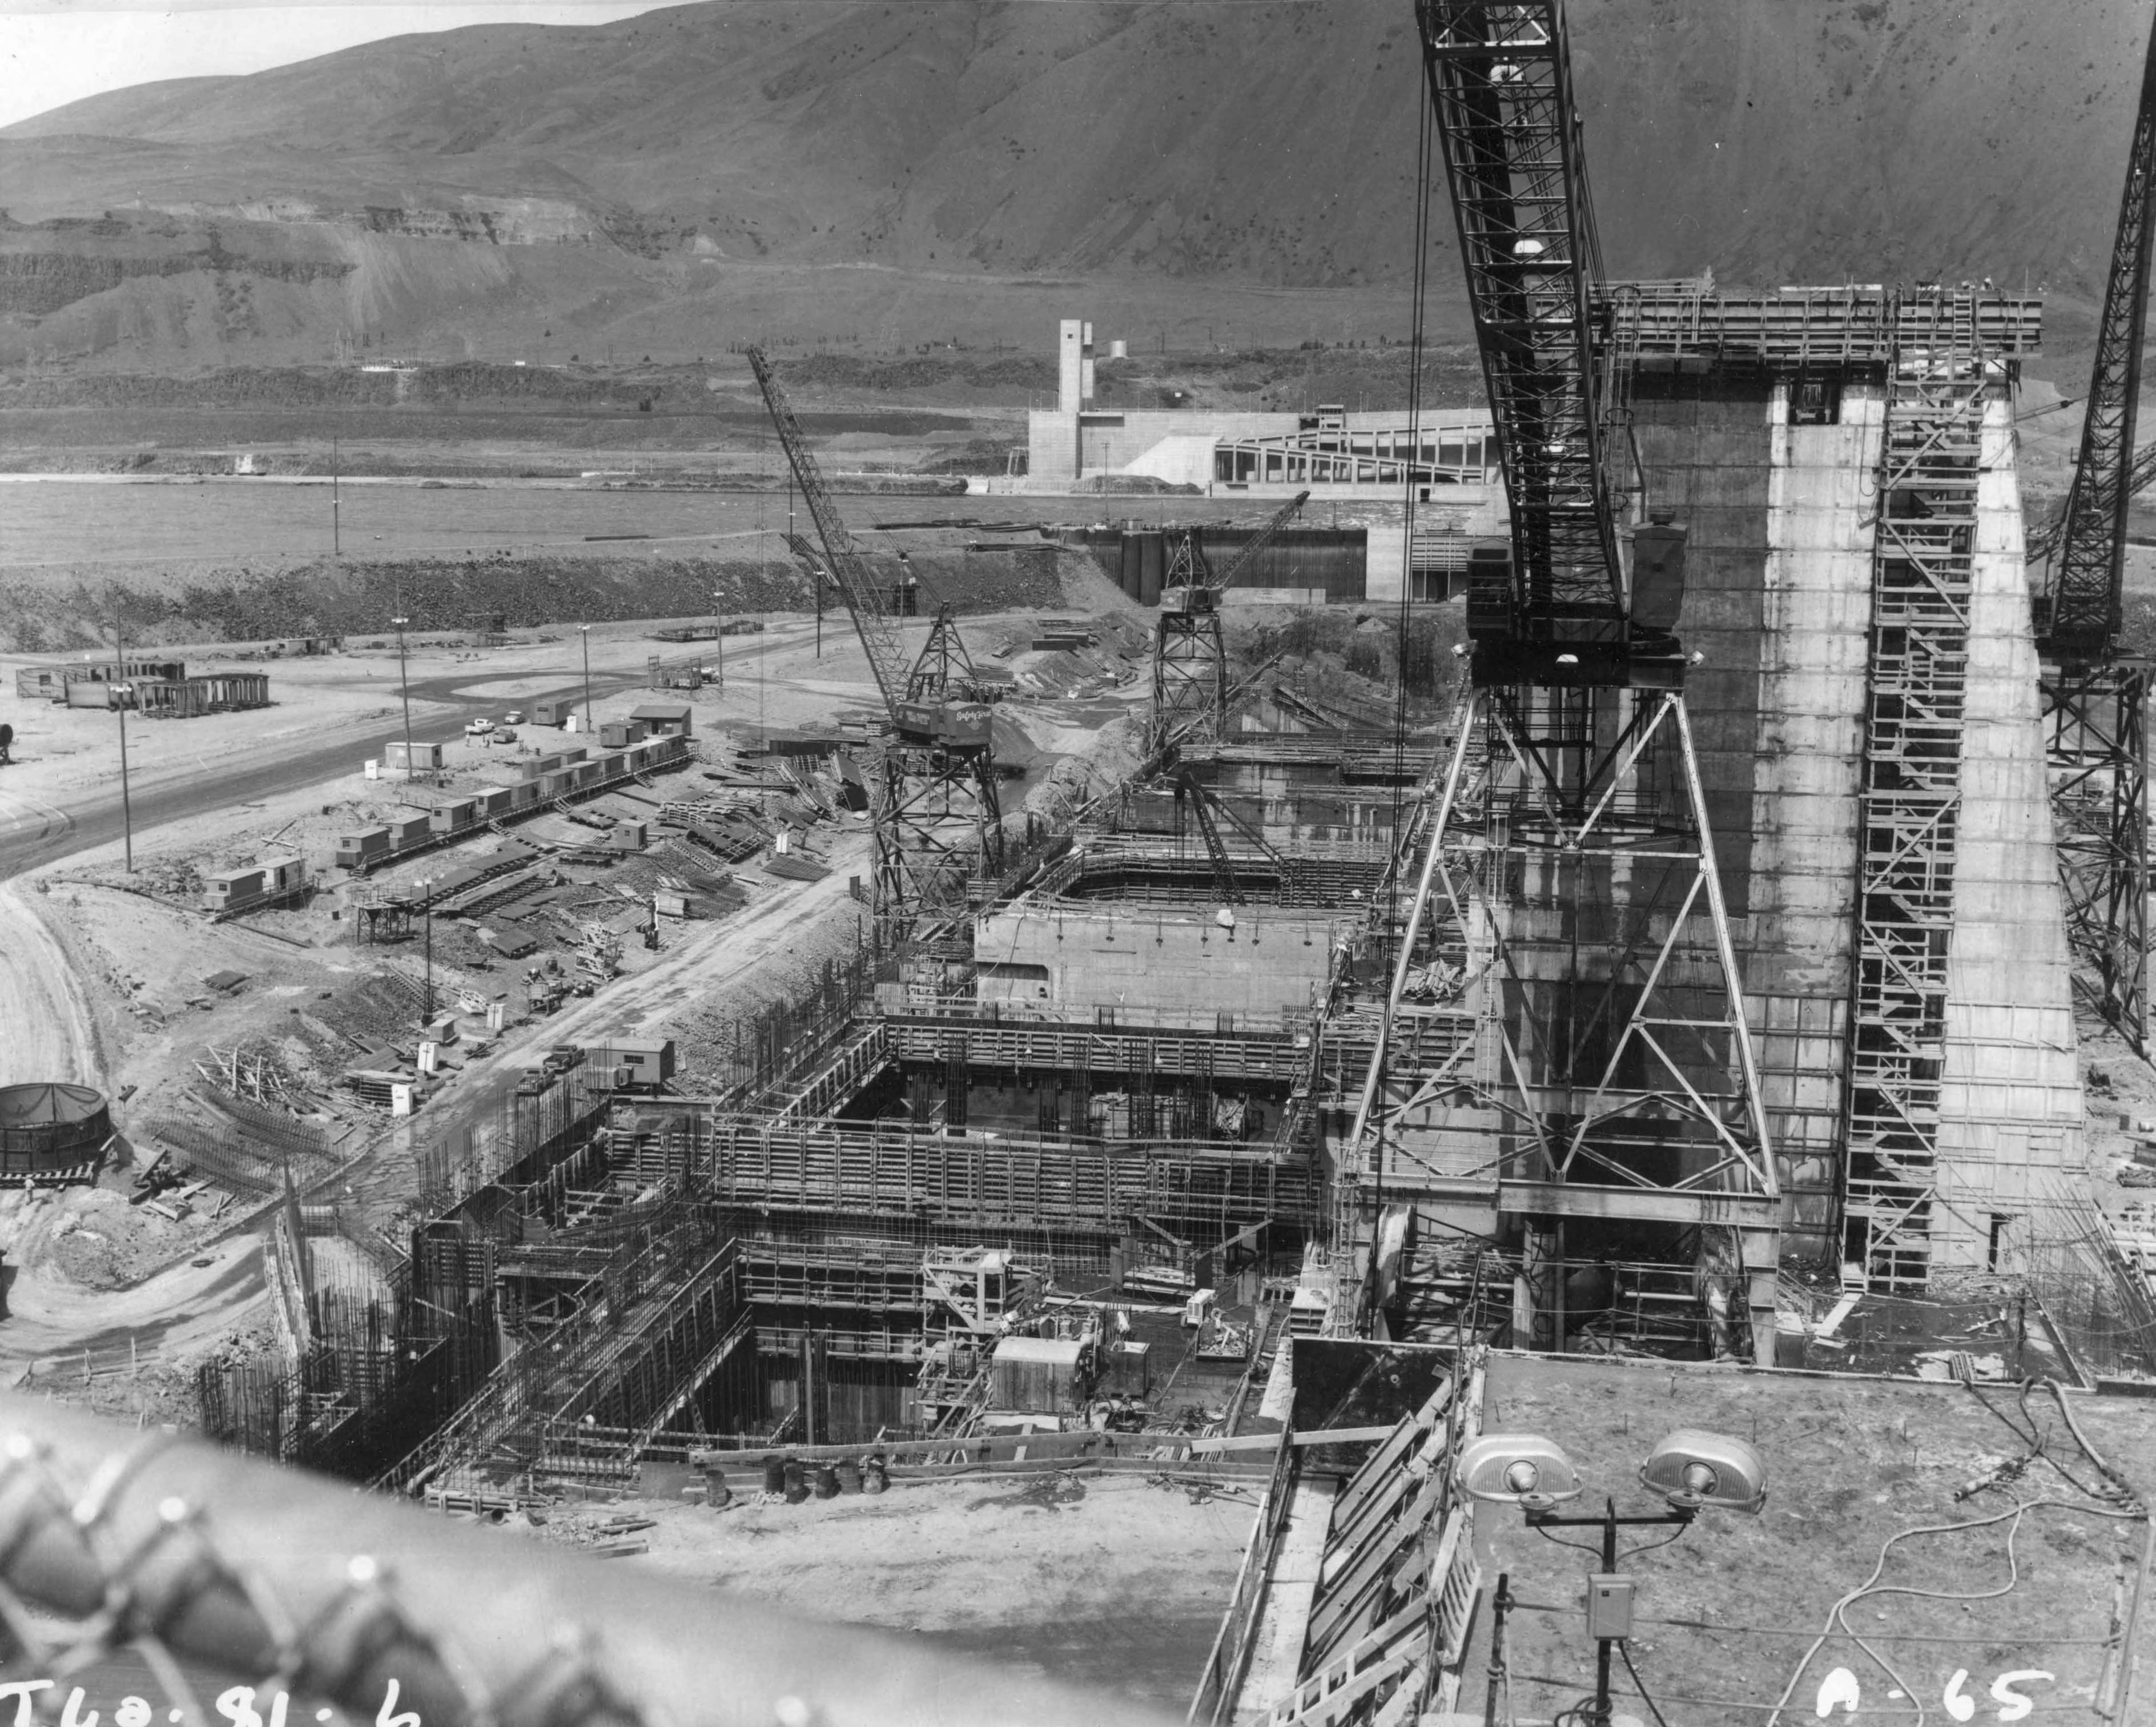
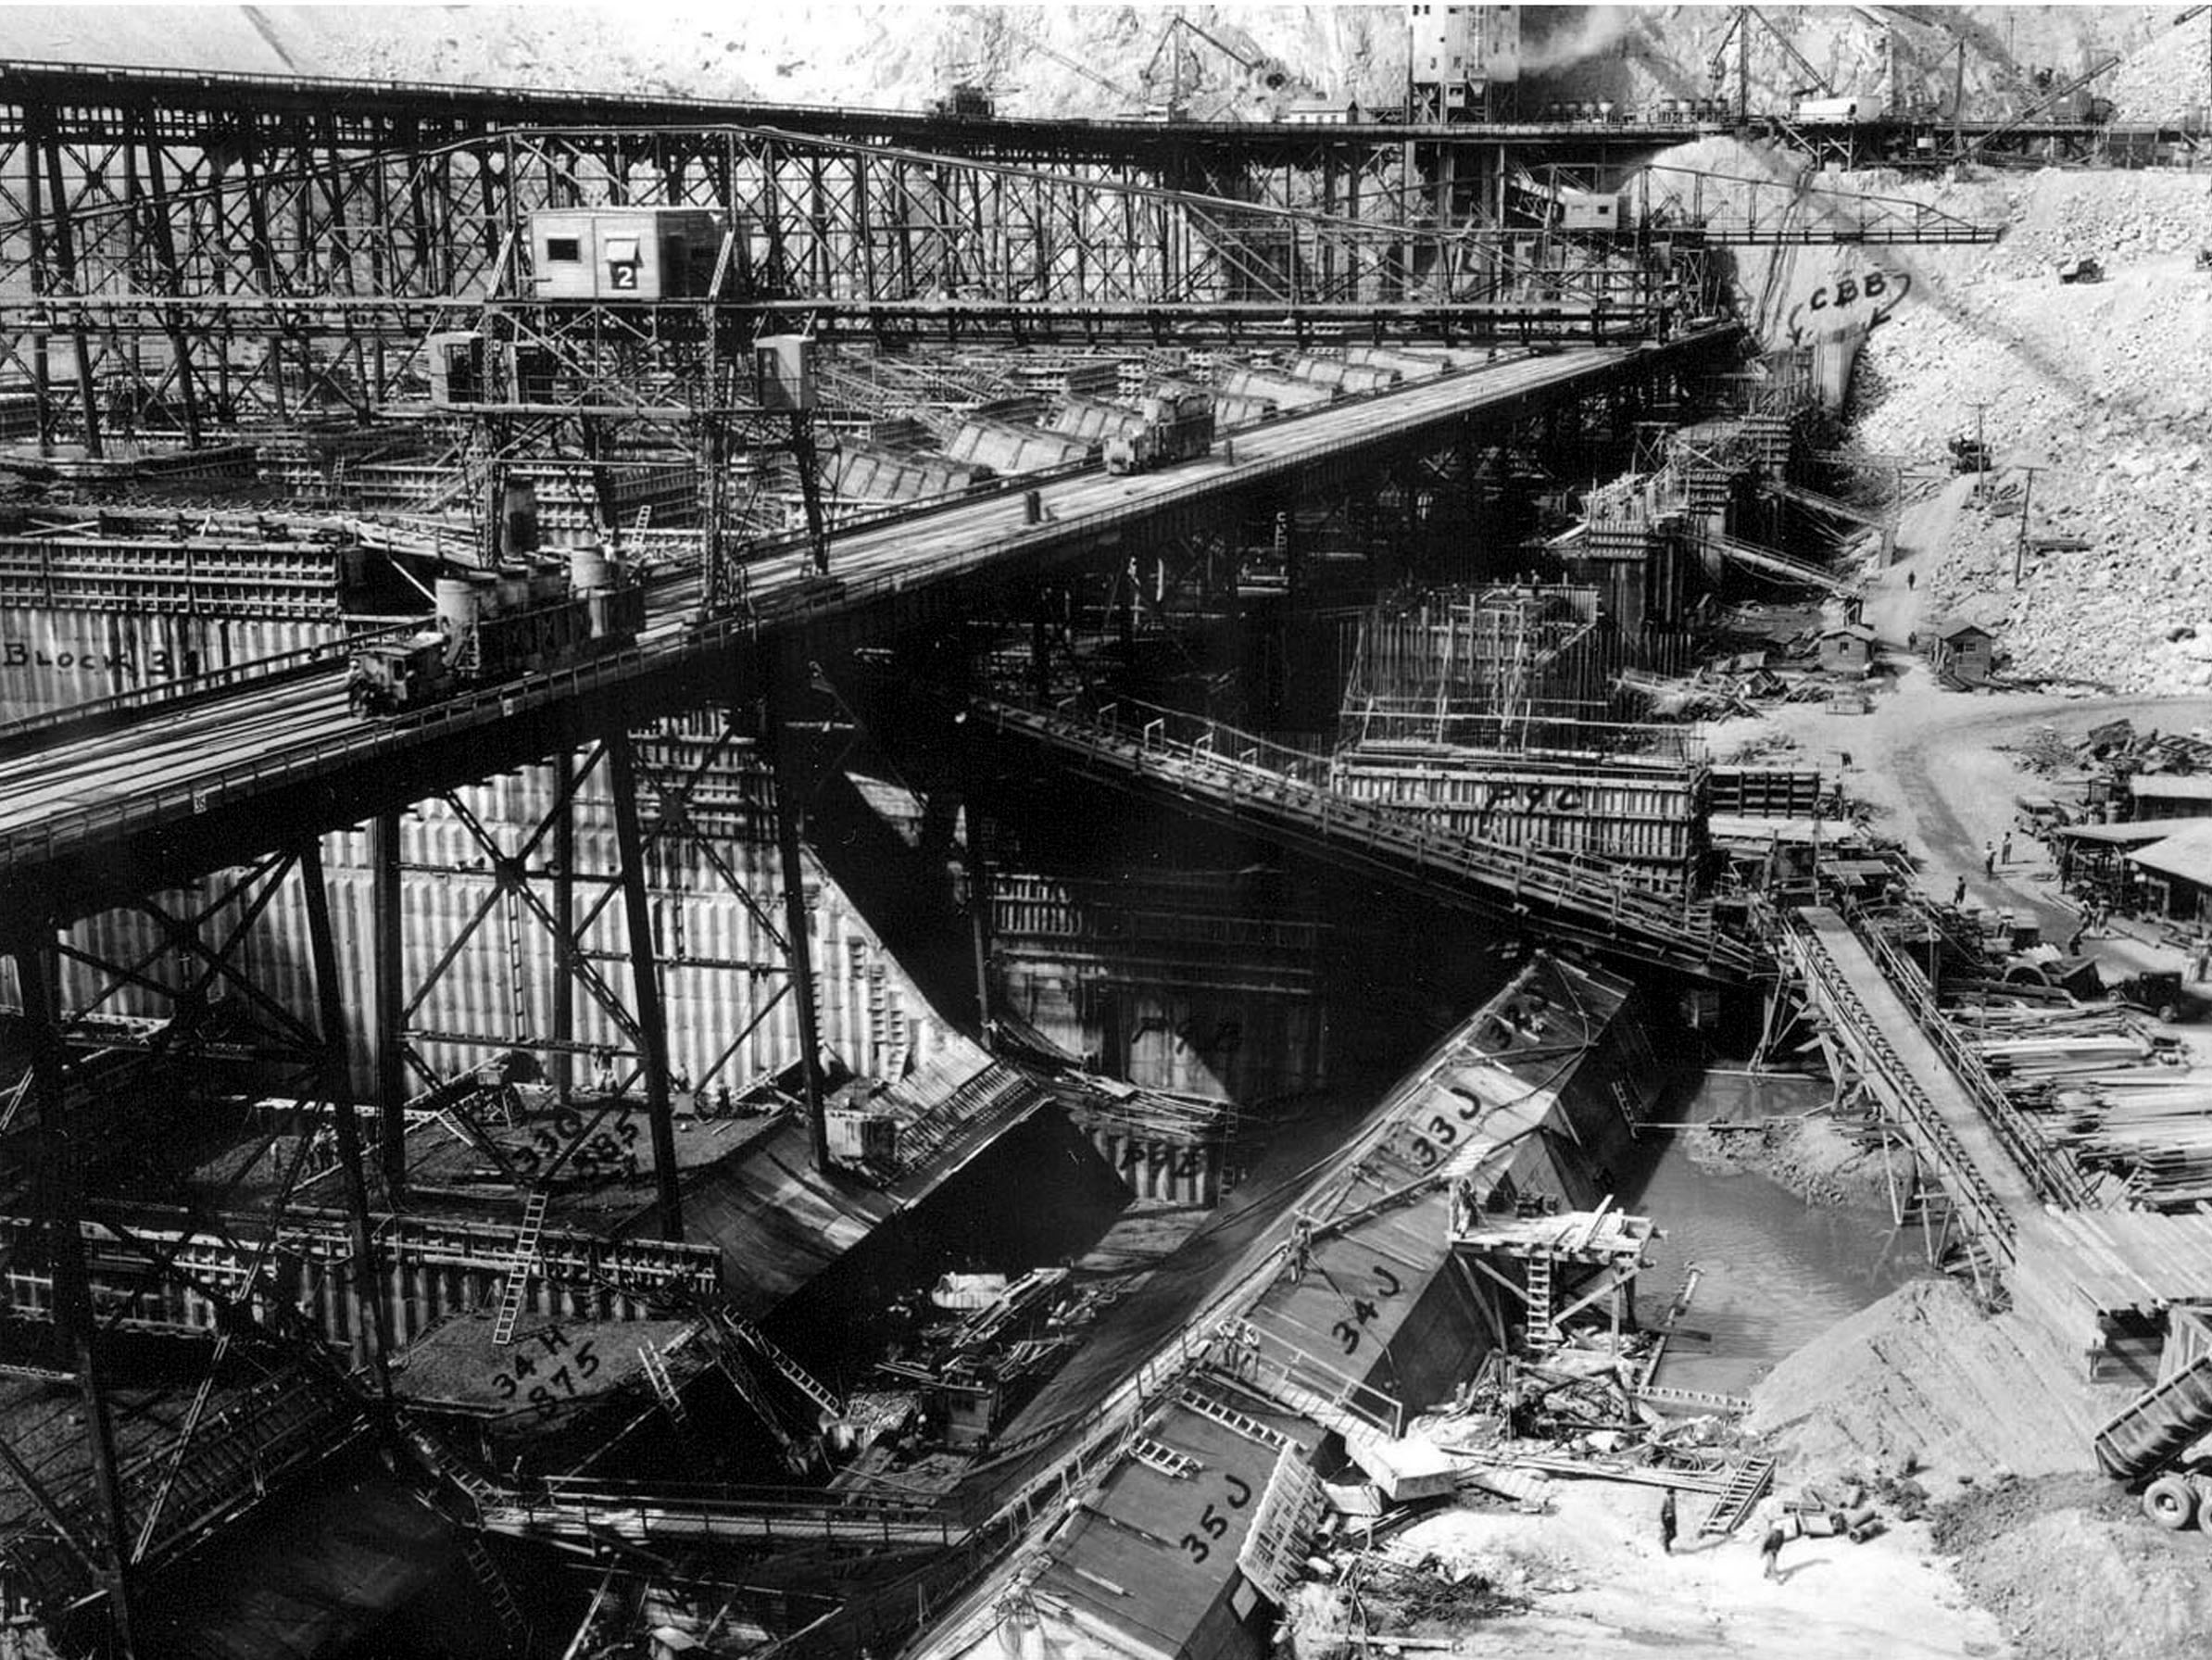
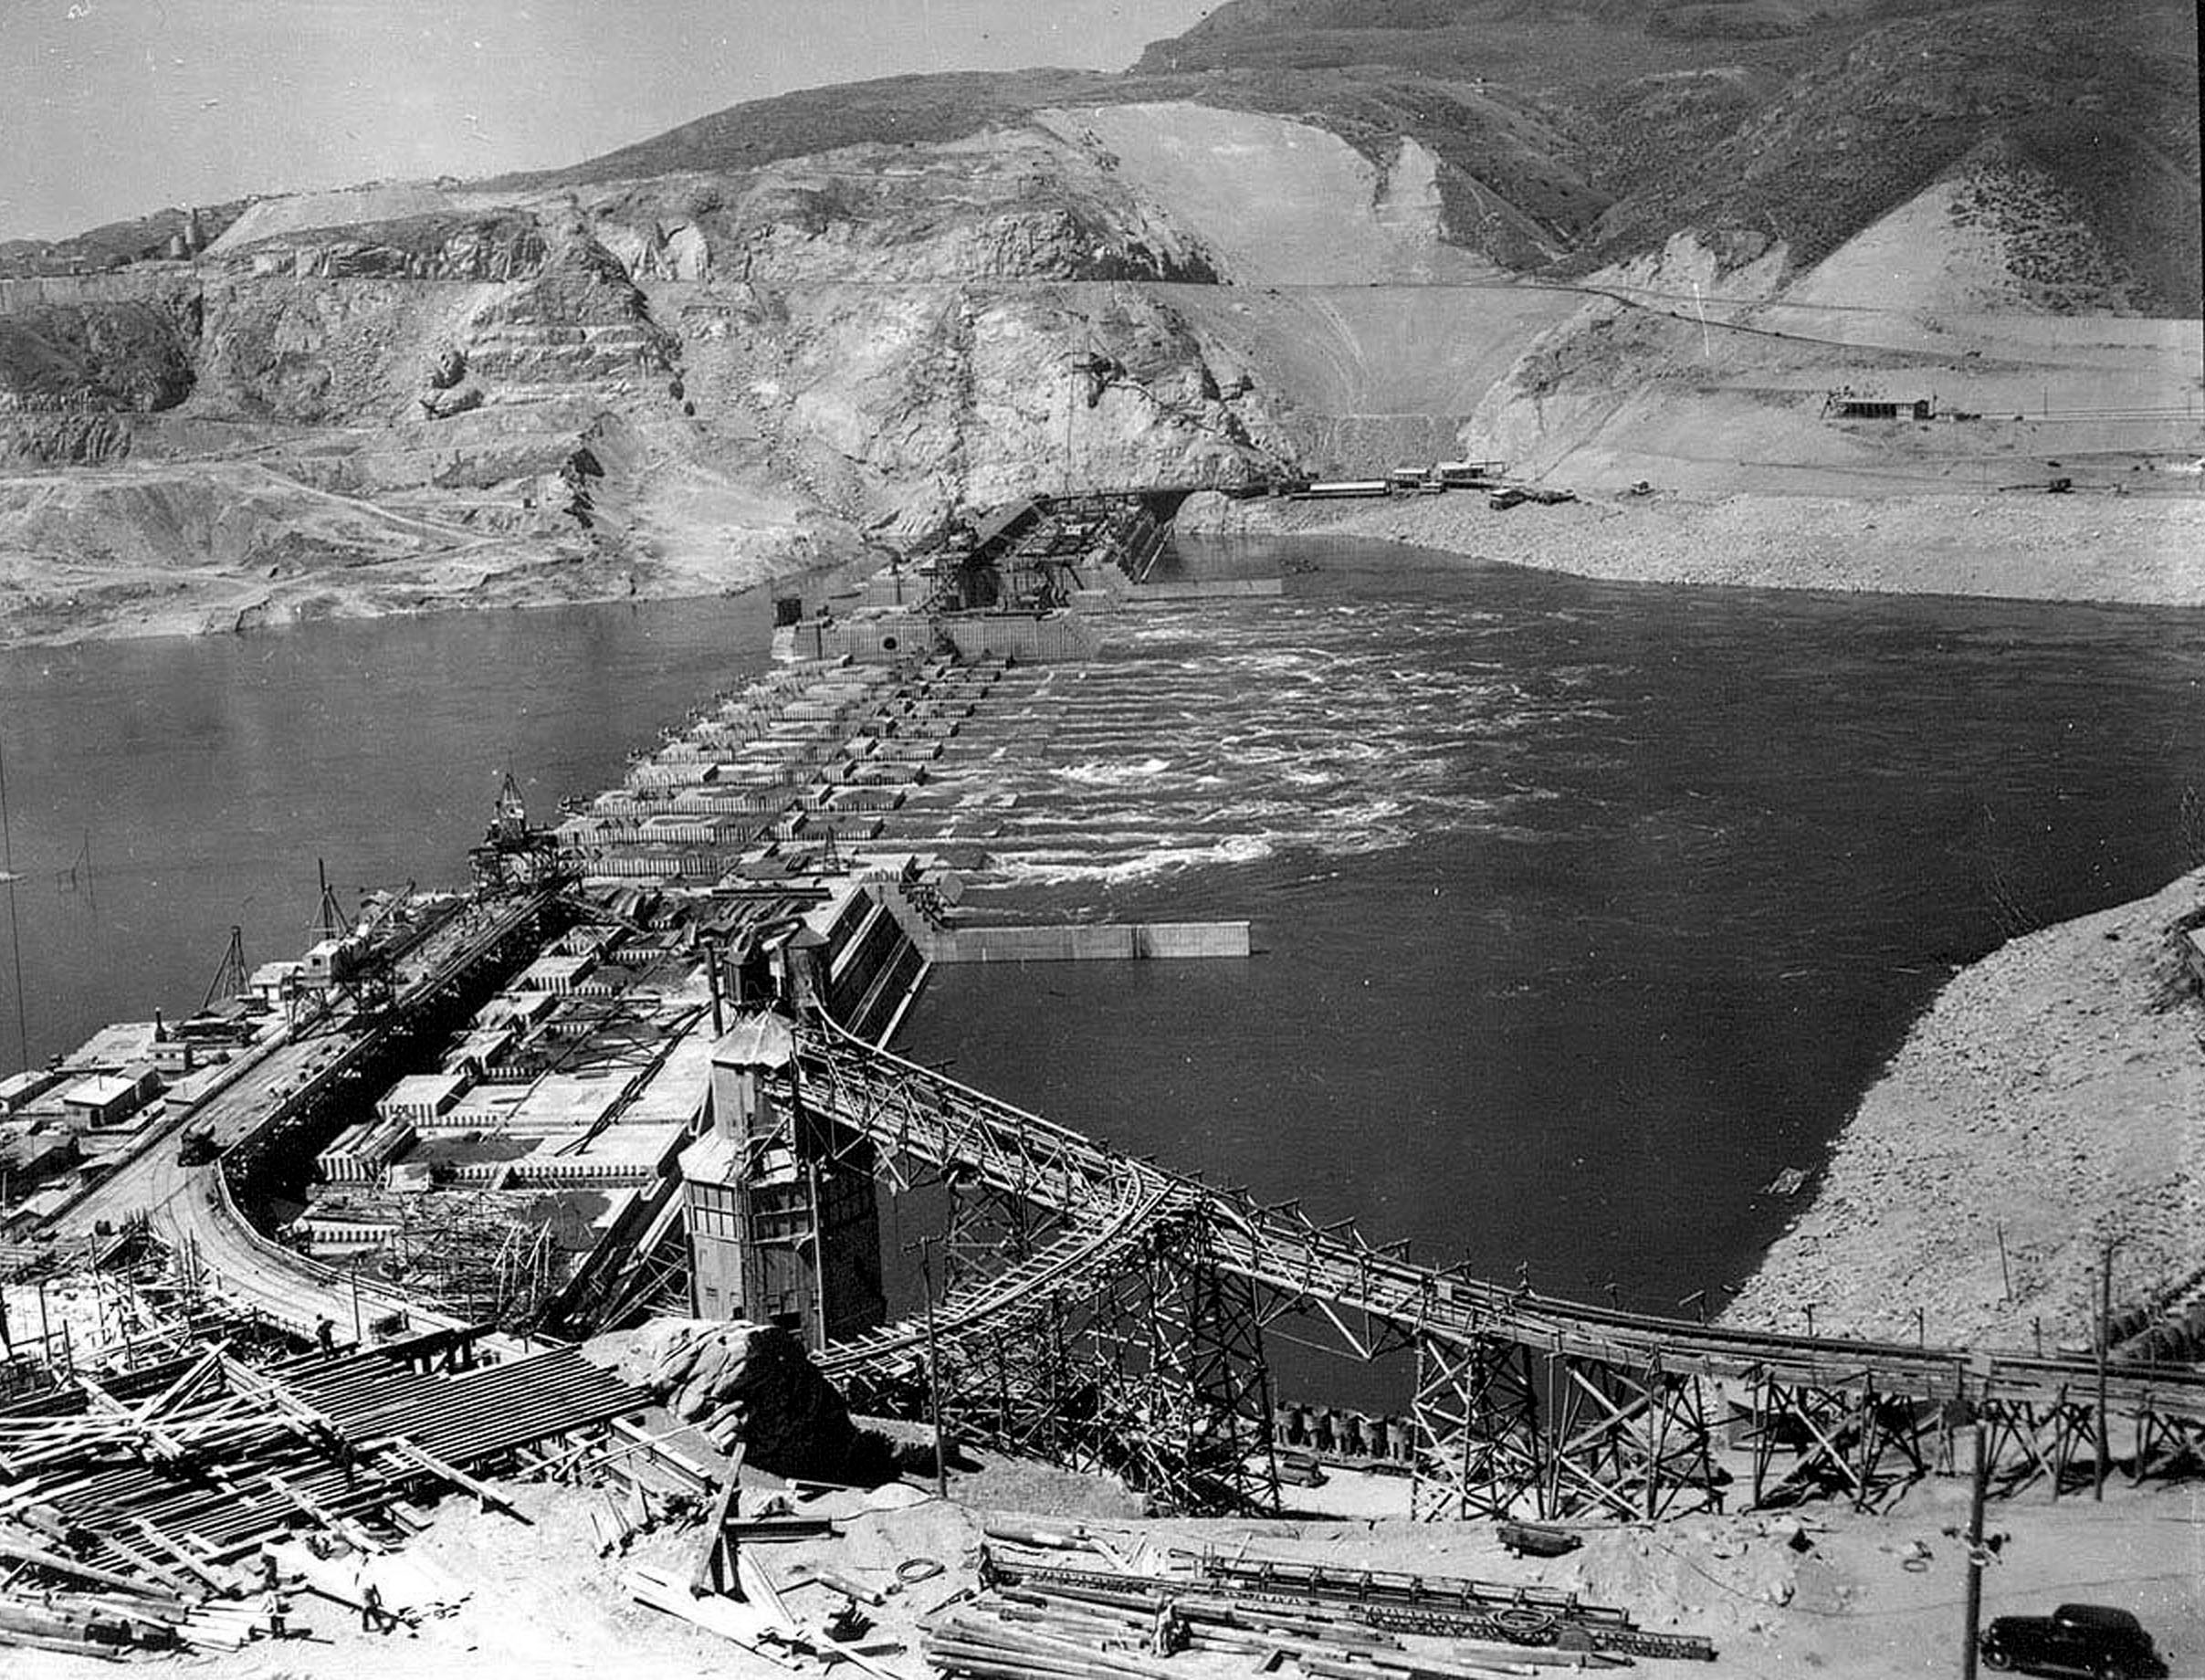
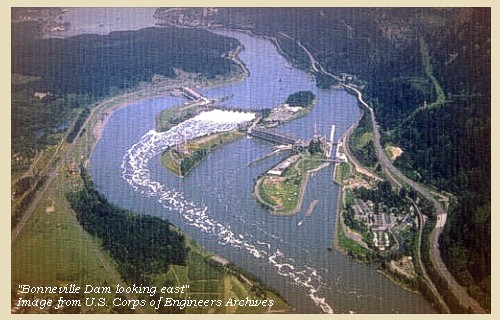
    The PNW’s concrete dam era brought power and growth but devastated salmon runs and tribal fisheries. Recent removals are reversing these impacts. The 2024–2025 Klamath River project—the largest dam removal in history—freed the river after dismantling four concrete dams, with rapid ecosystem recovery observed by late 2025.

    Klamath River dam removal site

    Site during Klamath River dam removal efforts

    Restored Klamath River flow

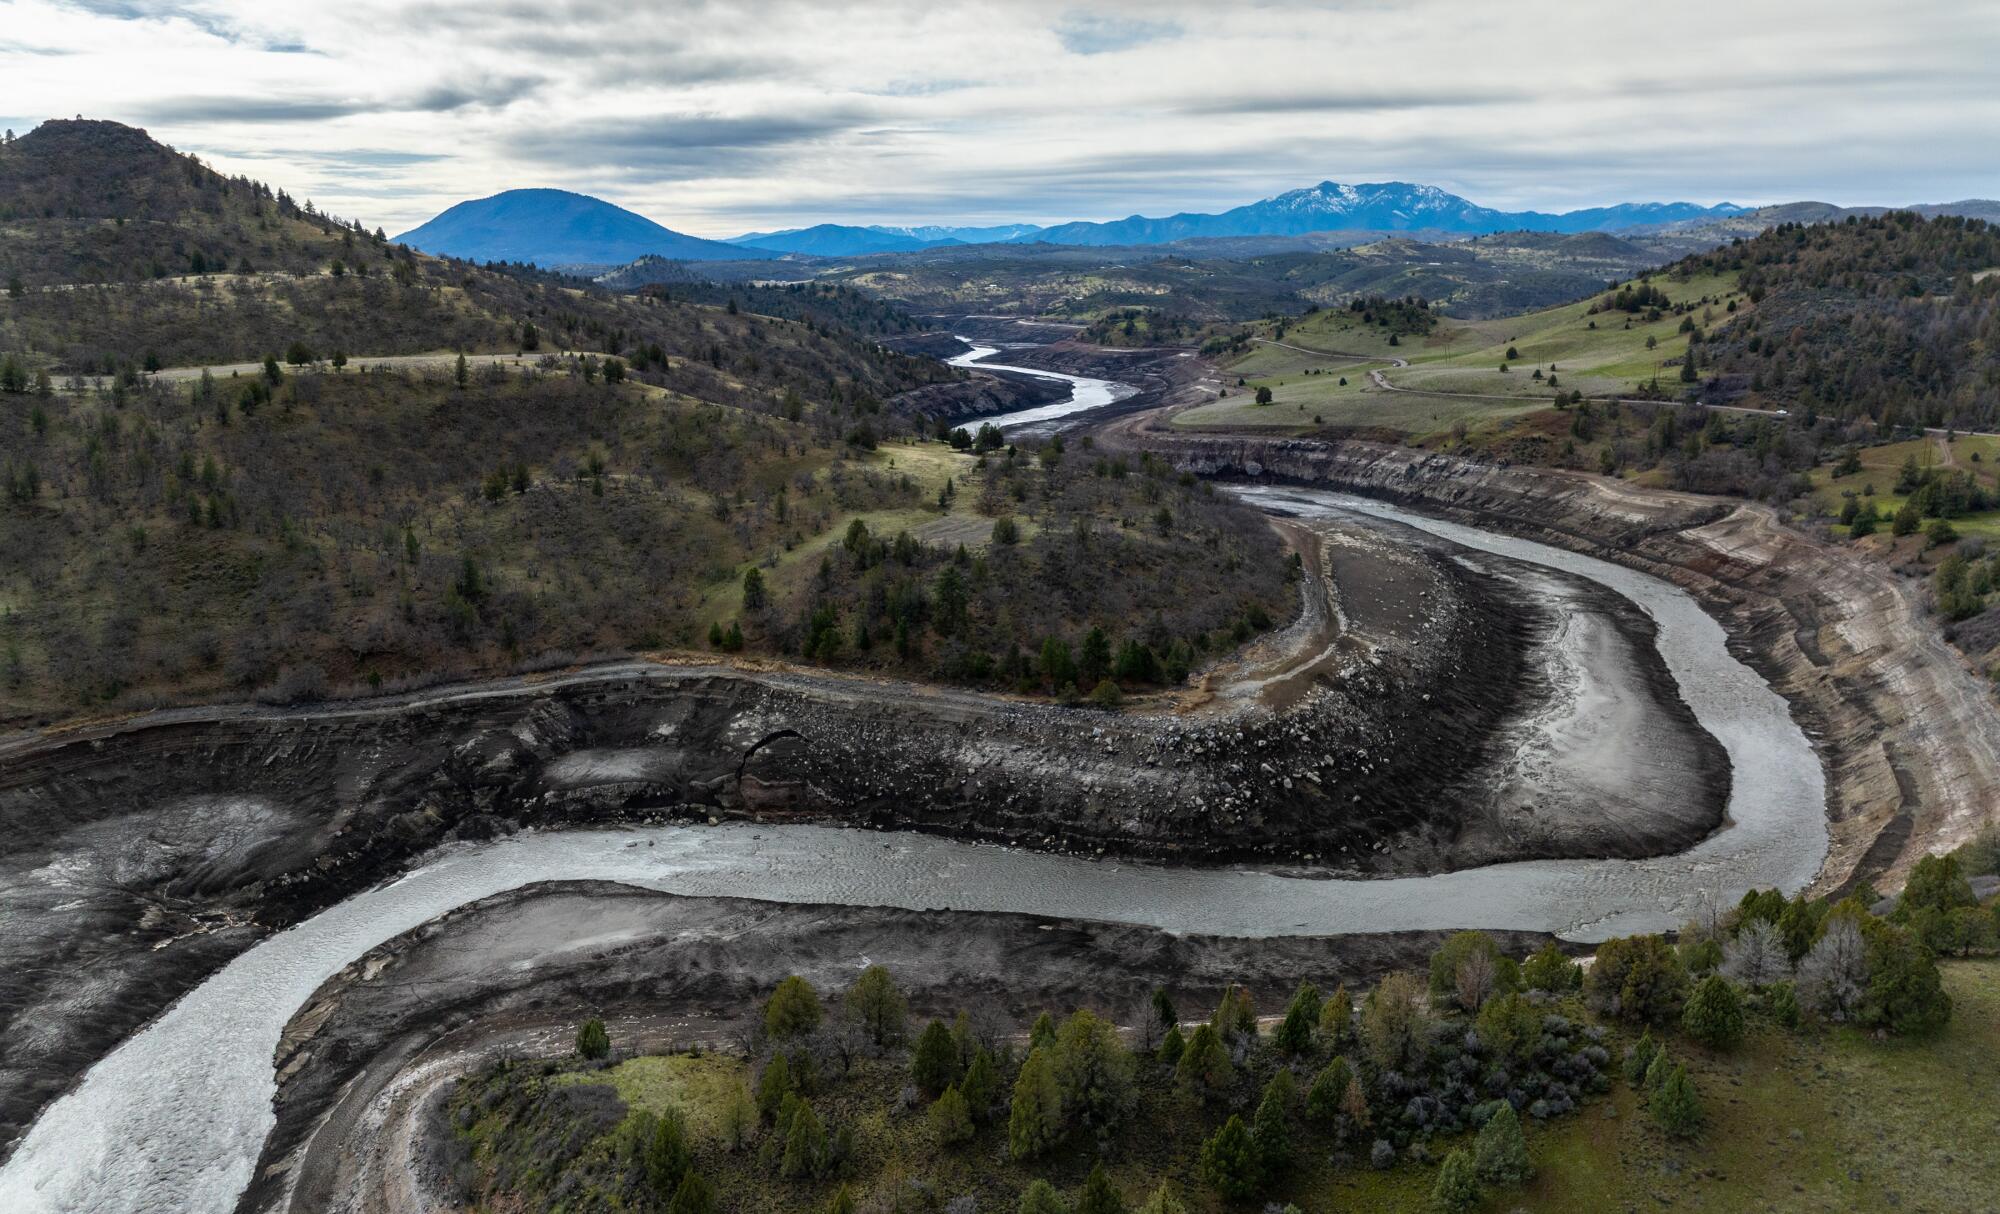
    Klamath River flowing freely post-dam removal

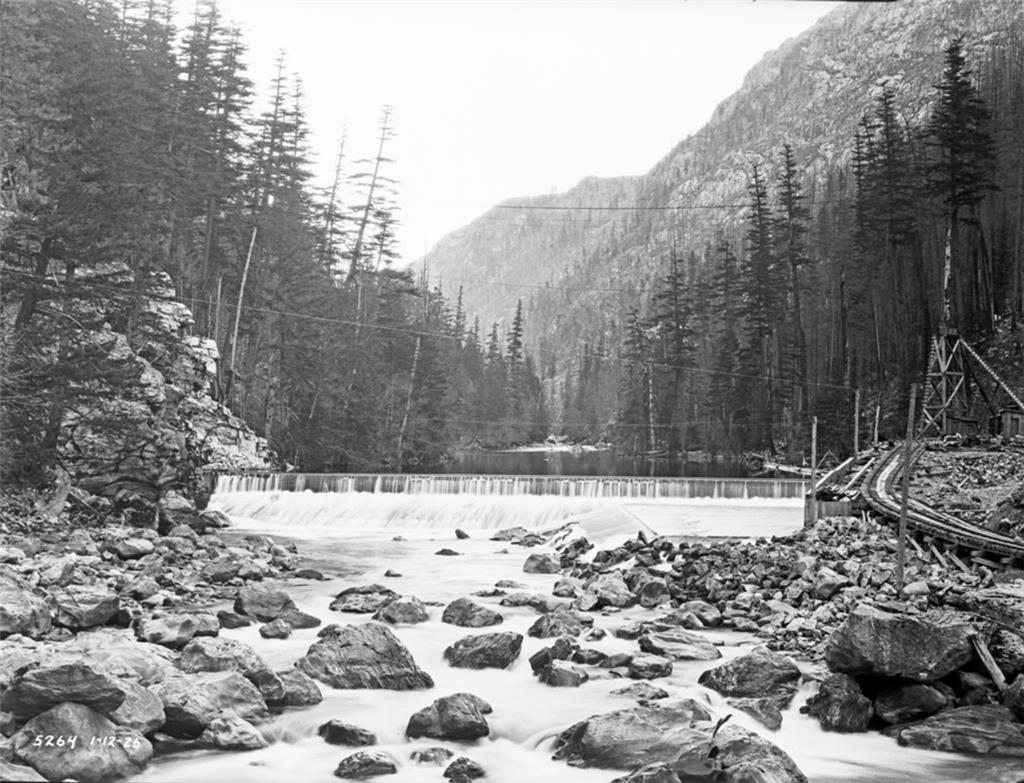
    Earlier successes like the Elwha River restoration (2011–2014) have seen salmon returns rebound dramatically, informing ongoing efforts.

    Elwha River dam remnants

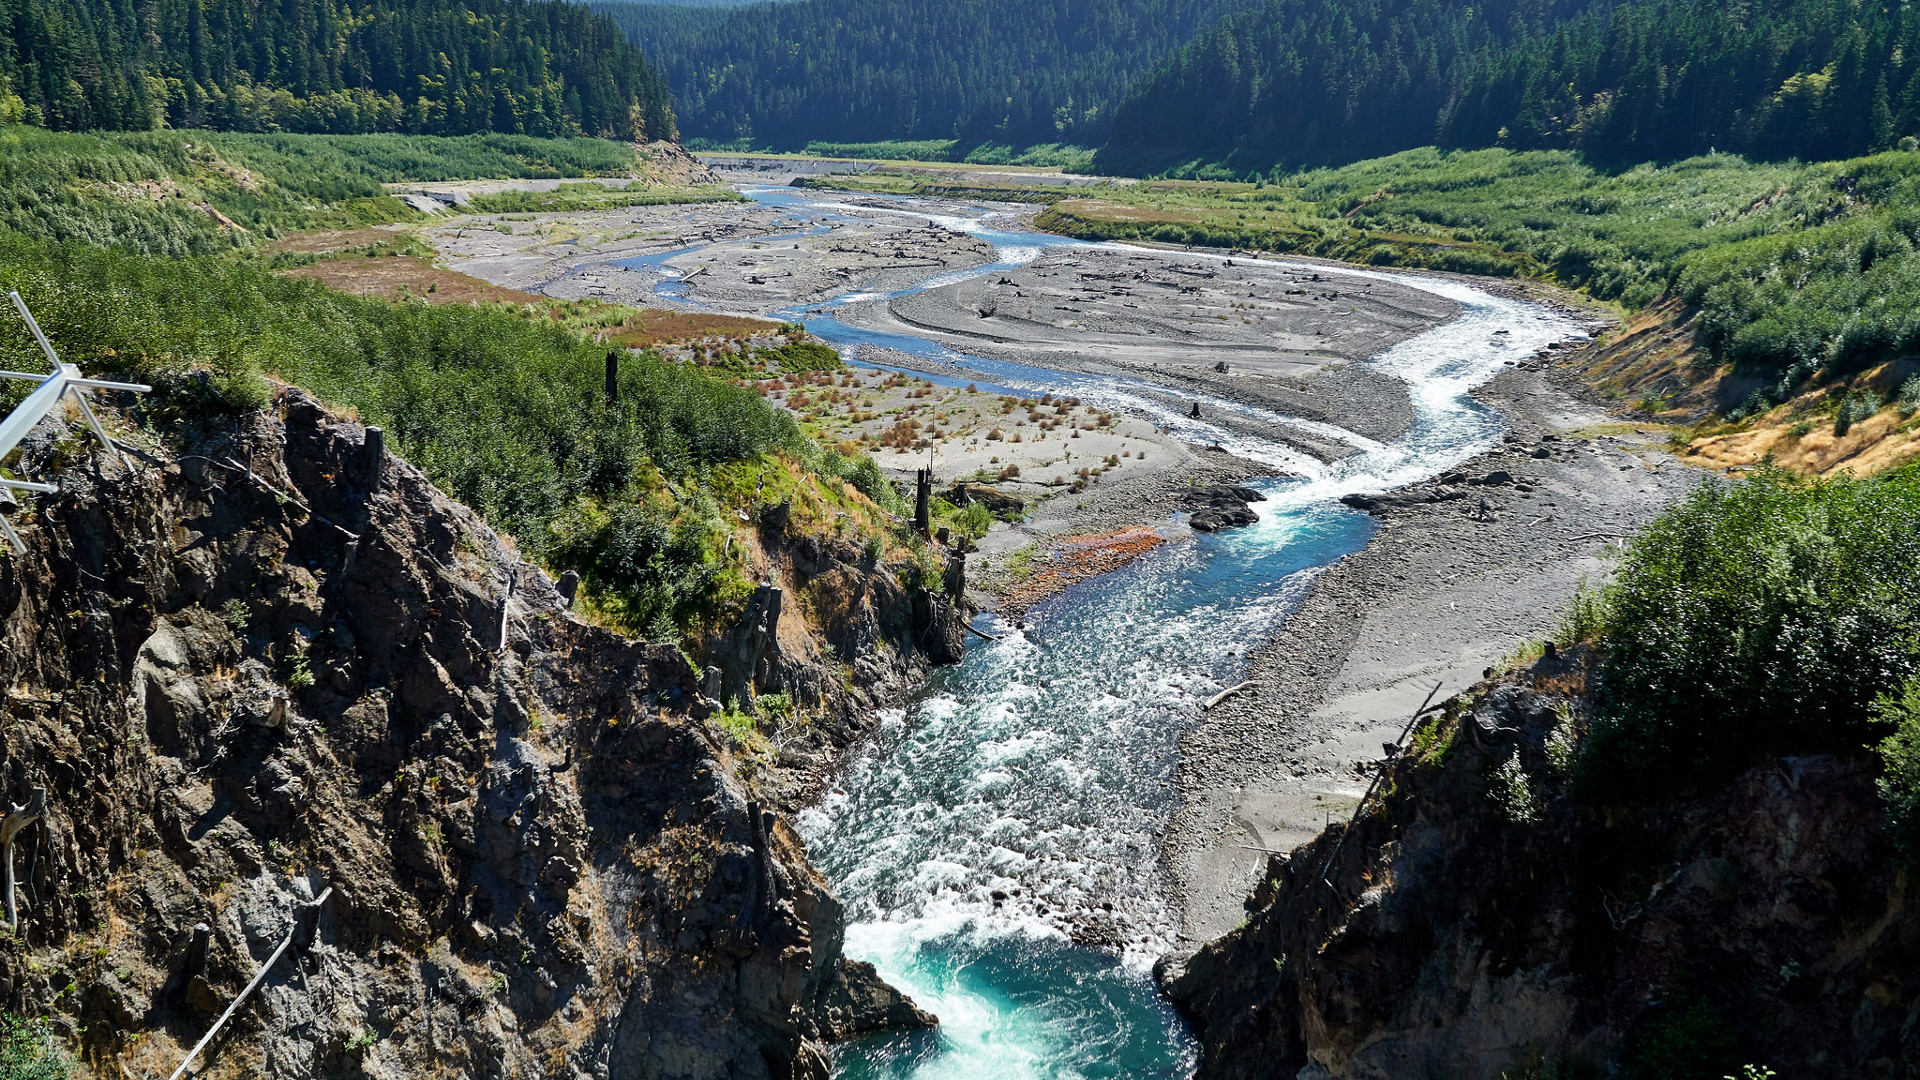
    Remnants of Glines Canyon Dam on the Elwha River

    Elwha River mouth restoration

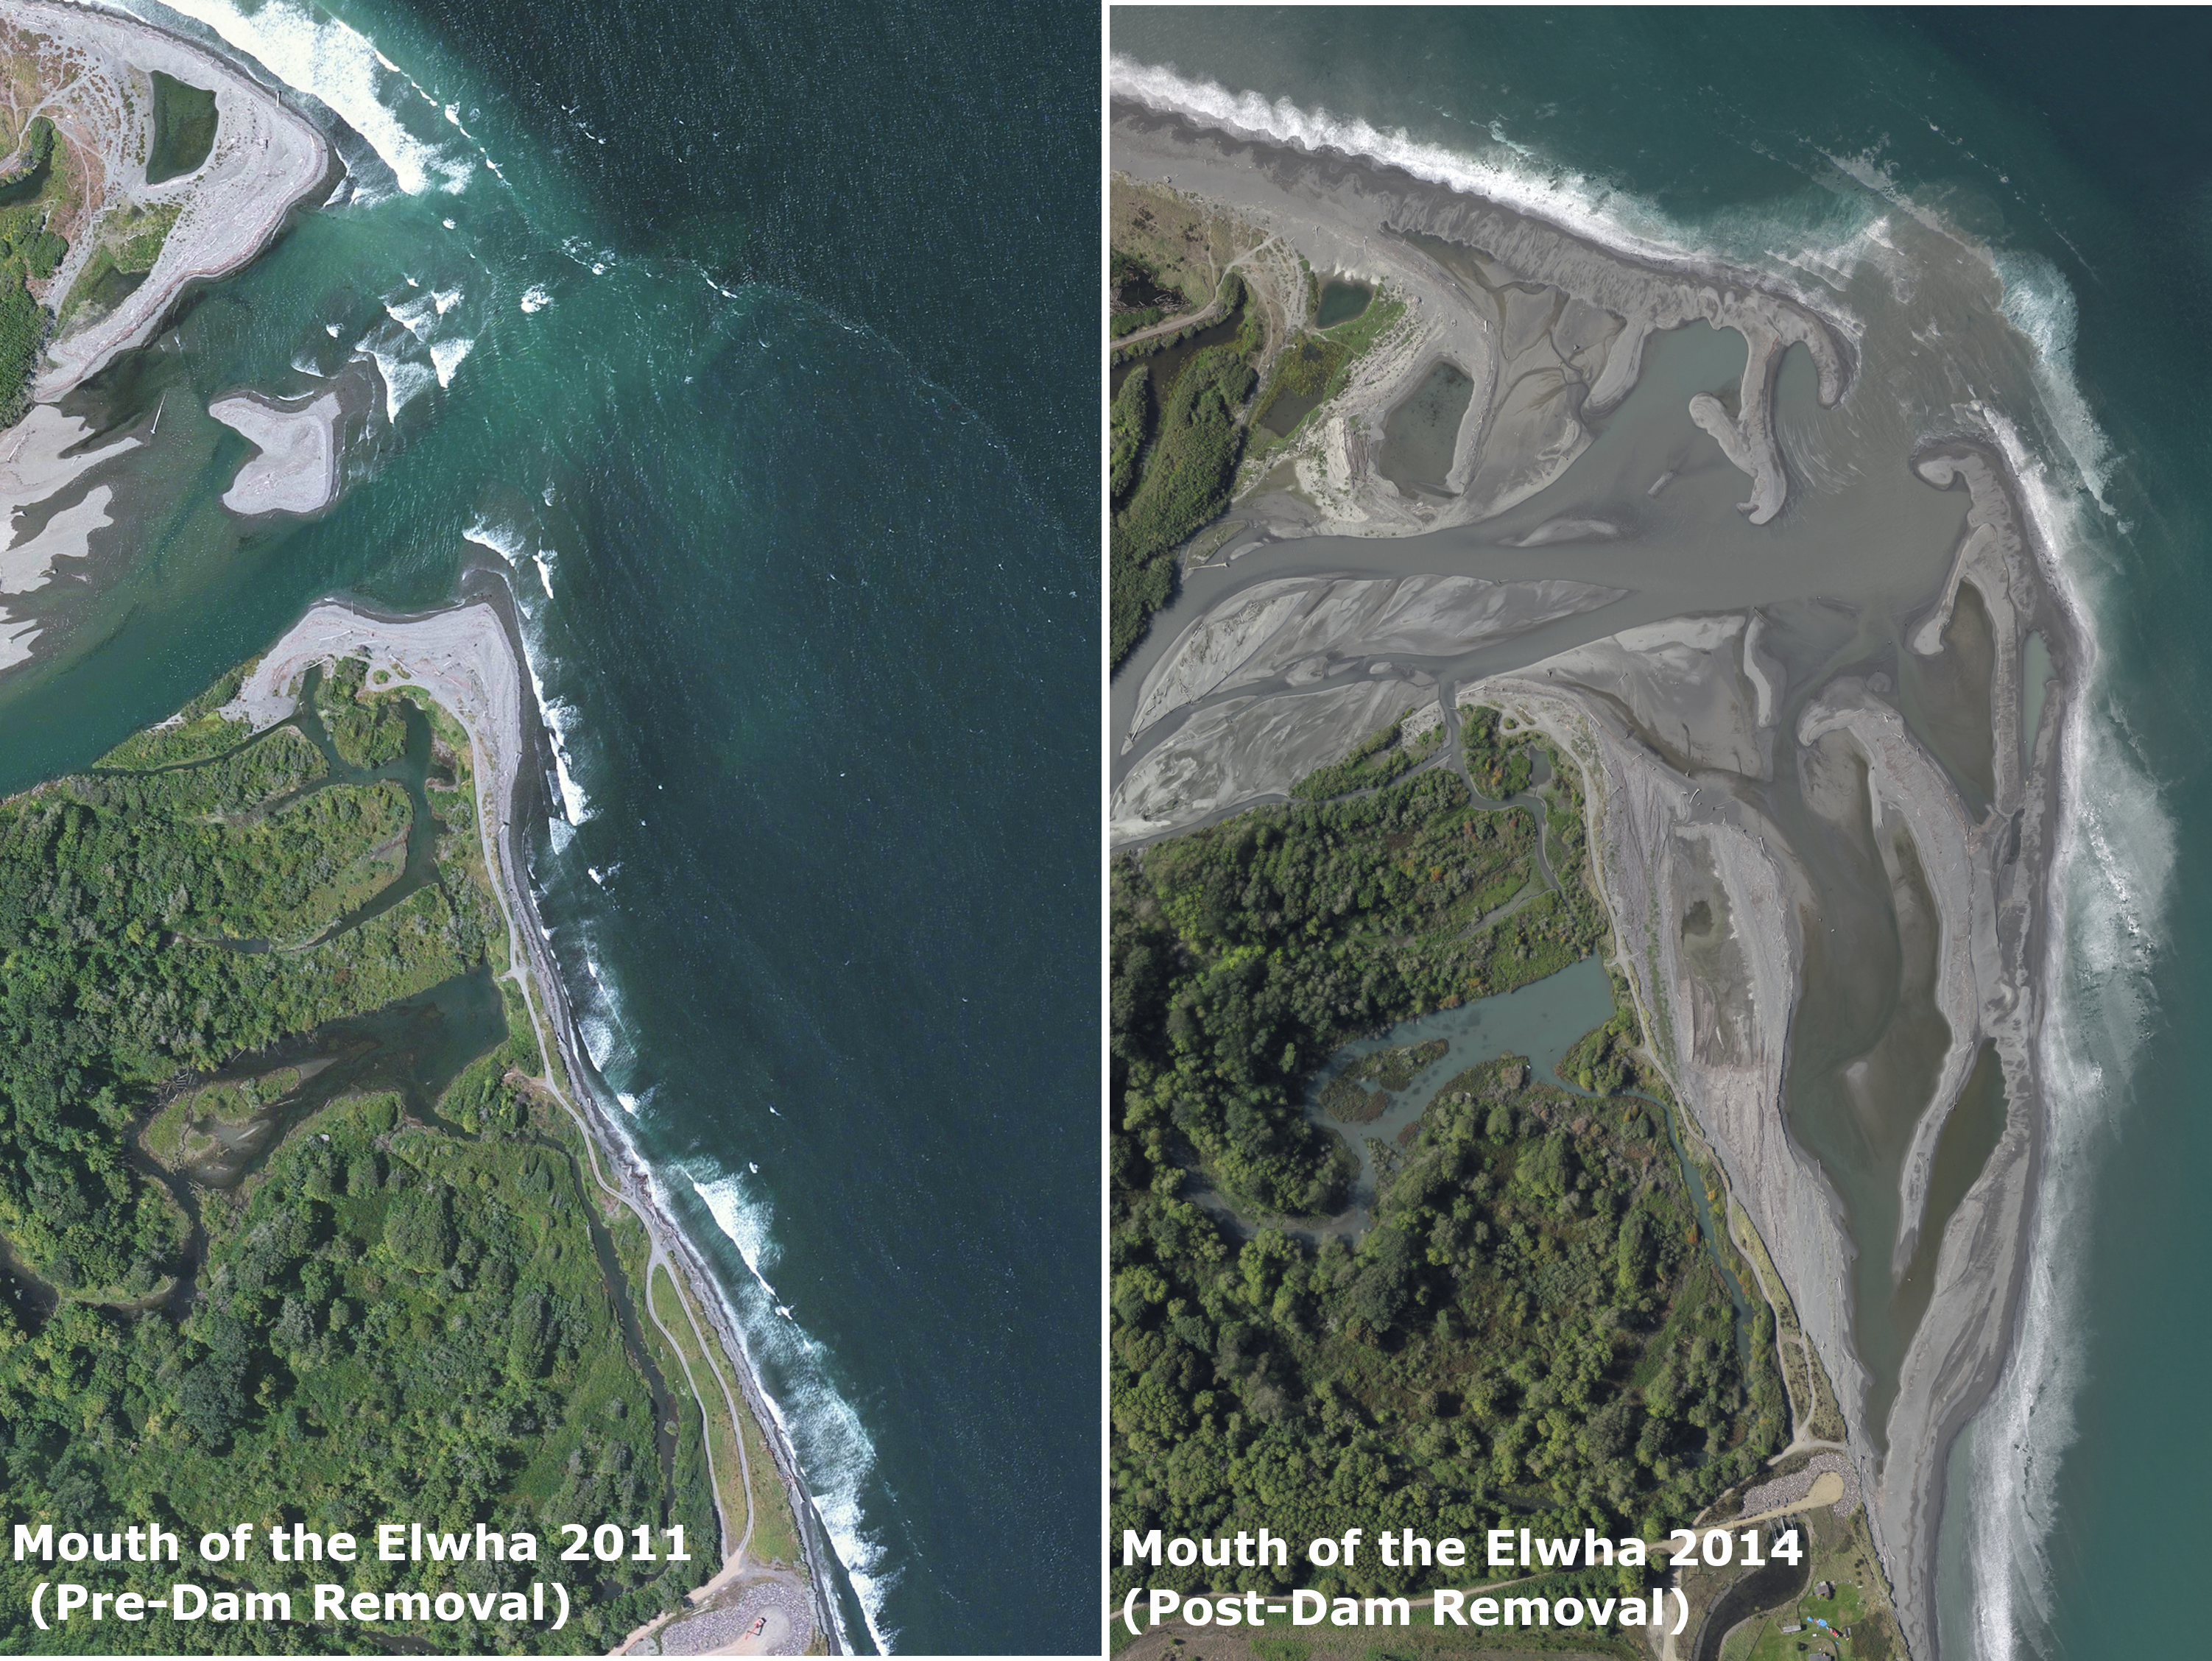
    Restored mouth of the Elwha River

    Conclusion: A Balanced Legacy

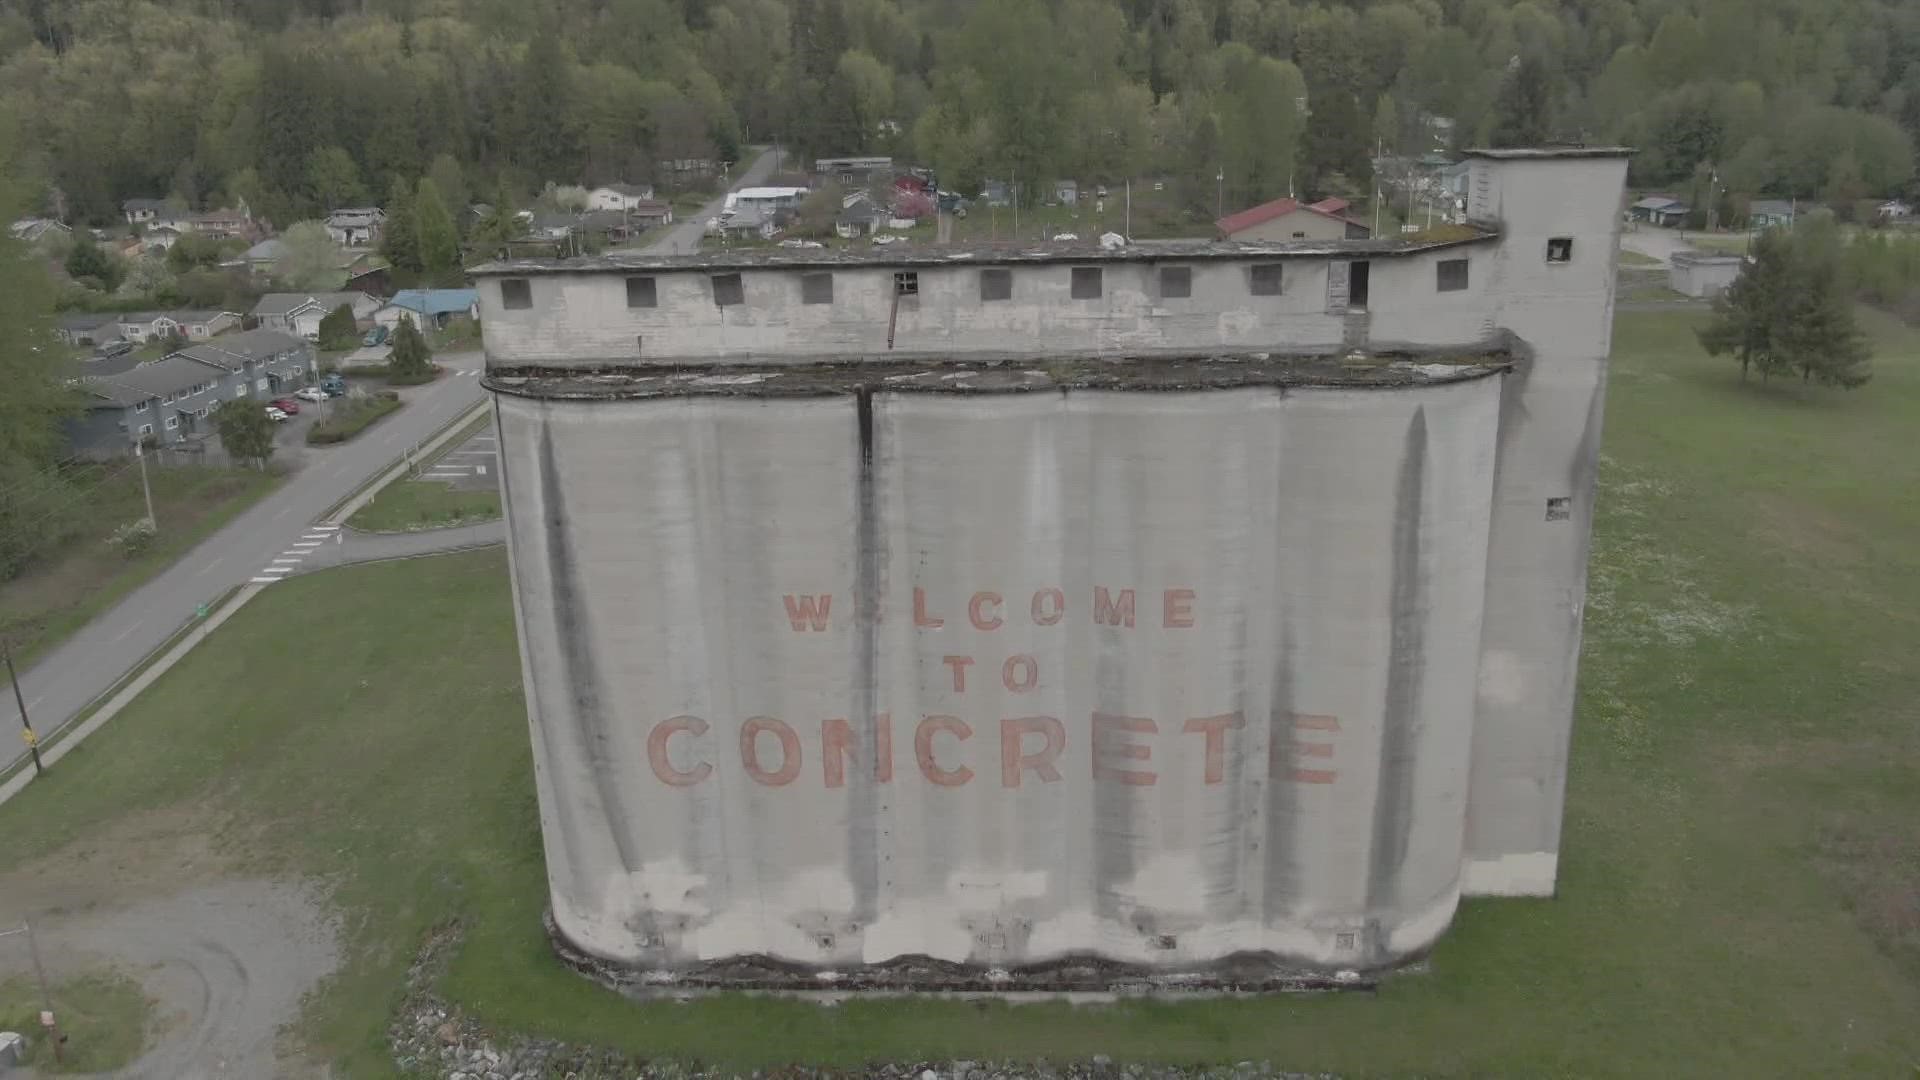
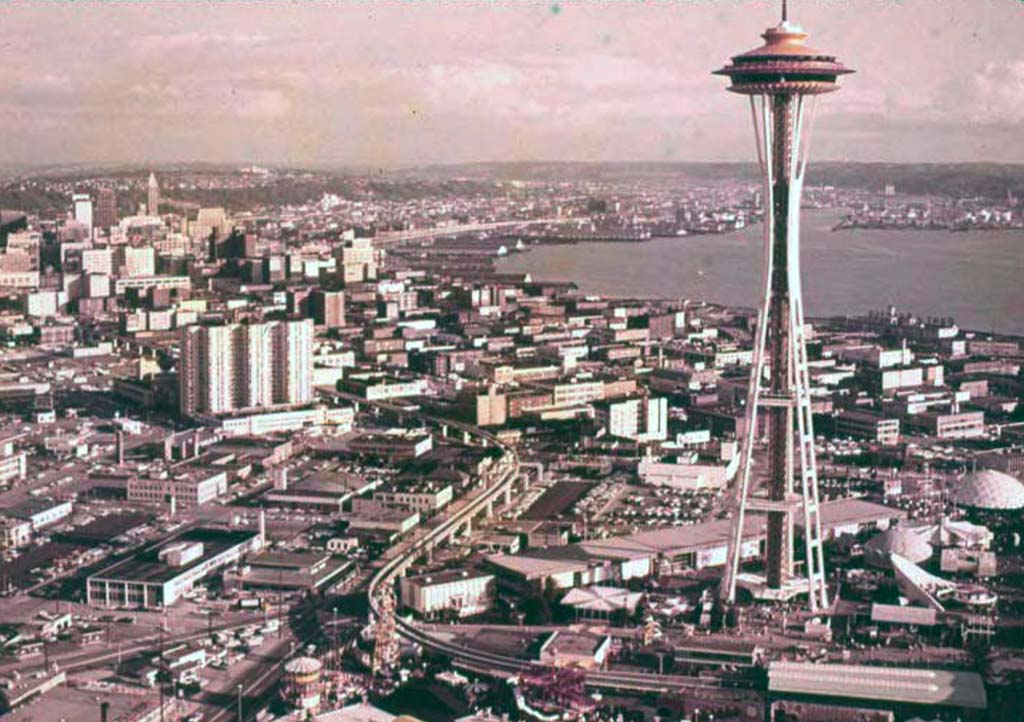
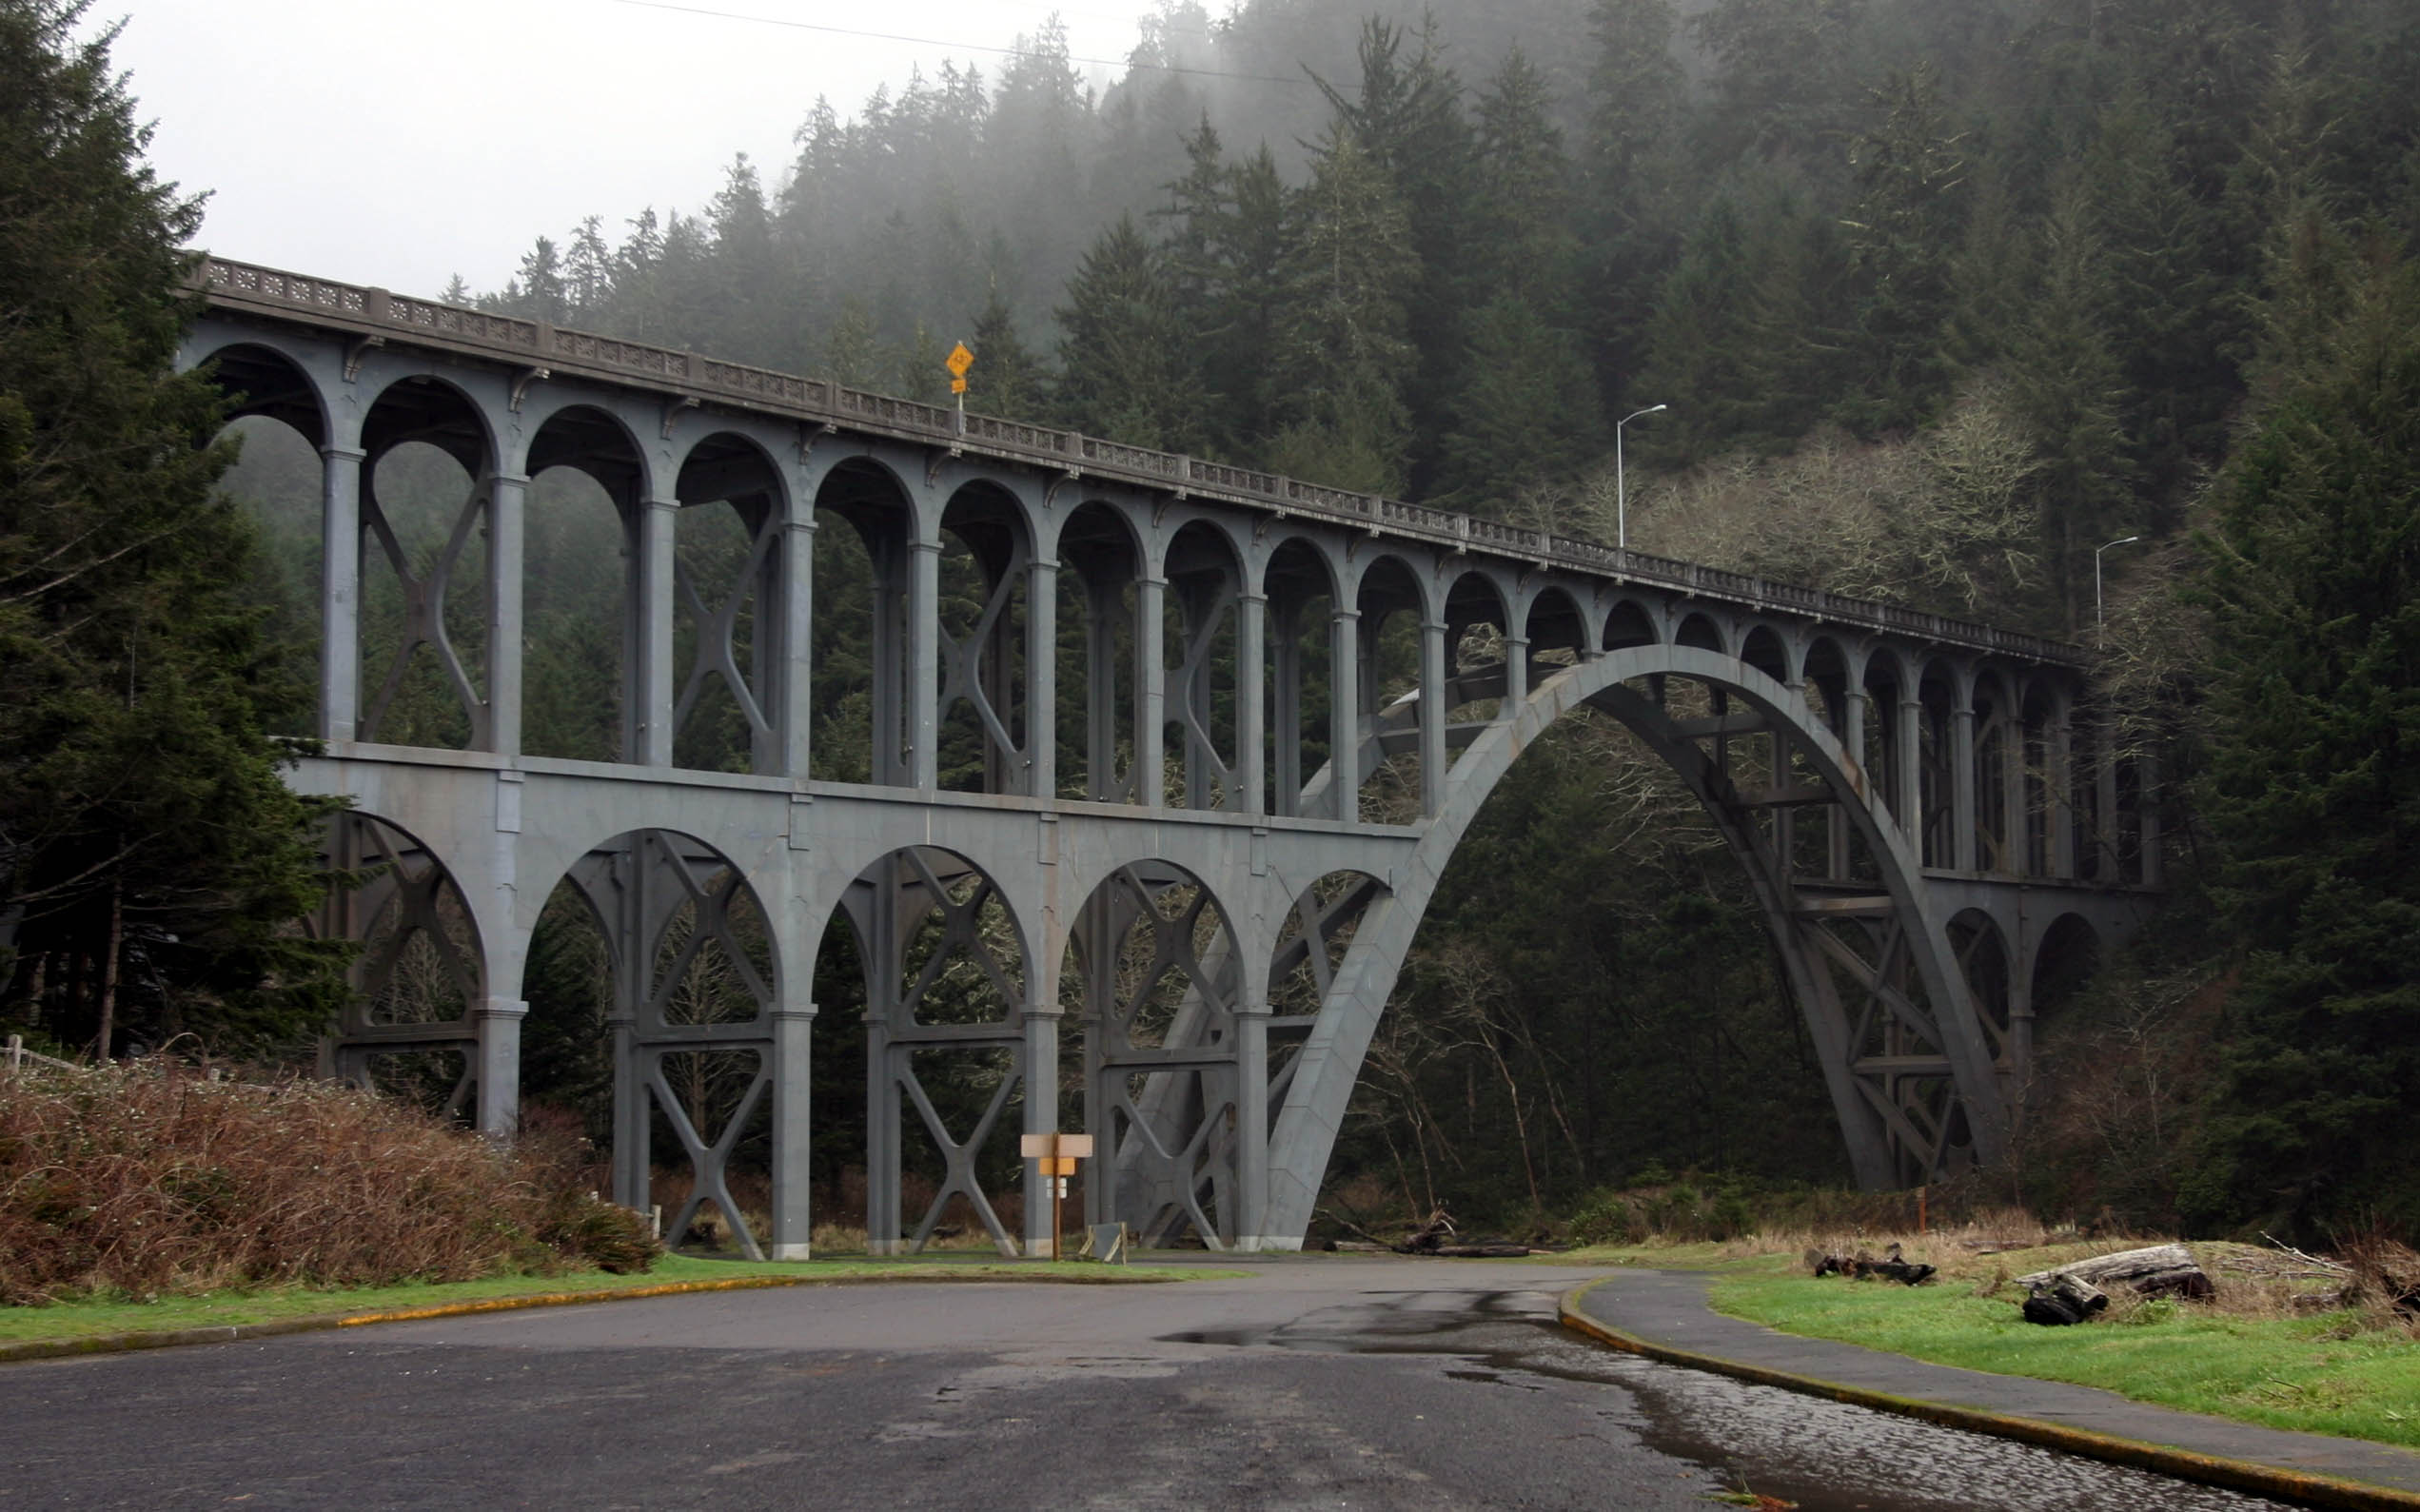
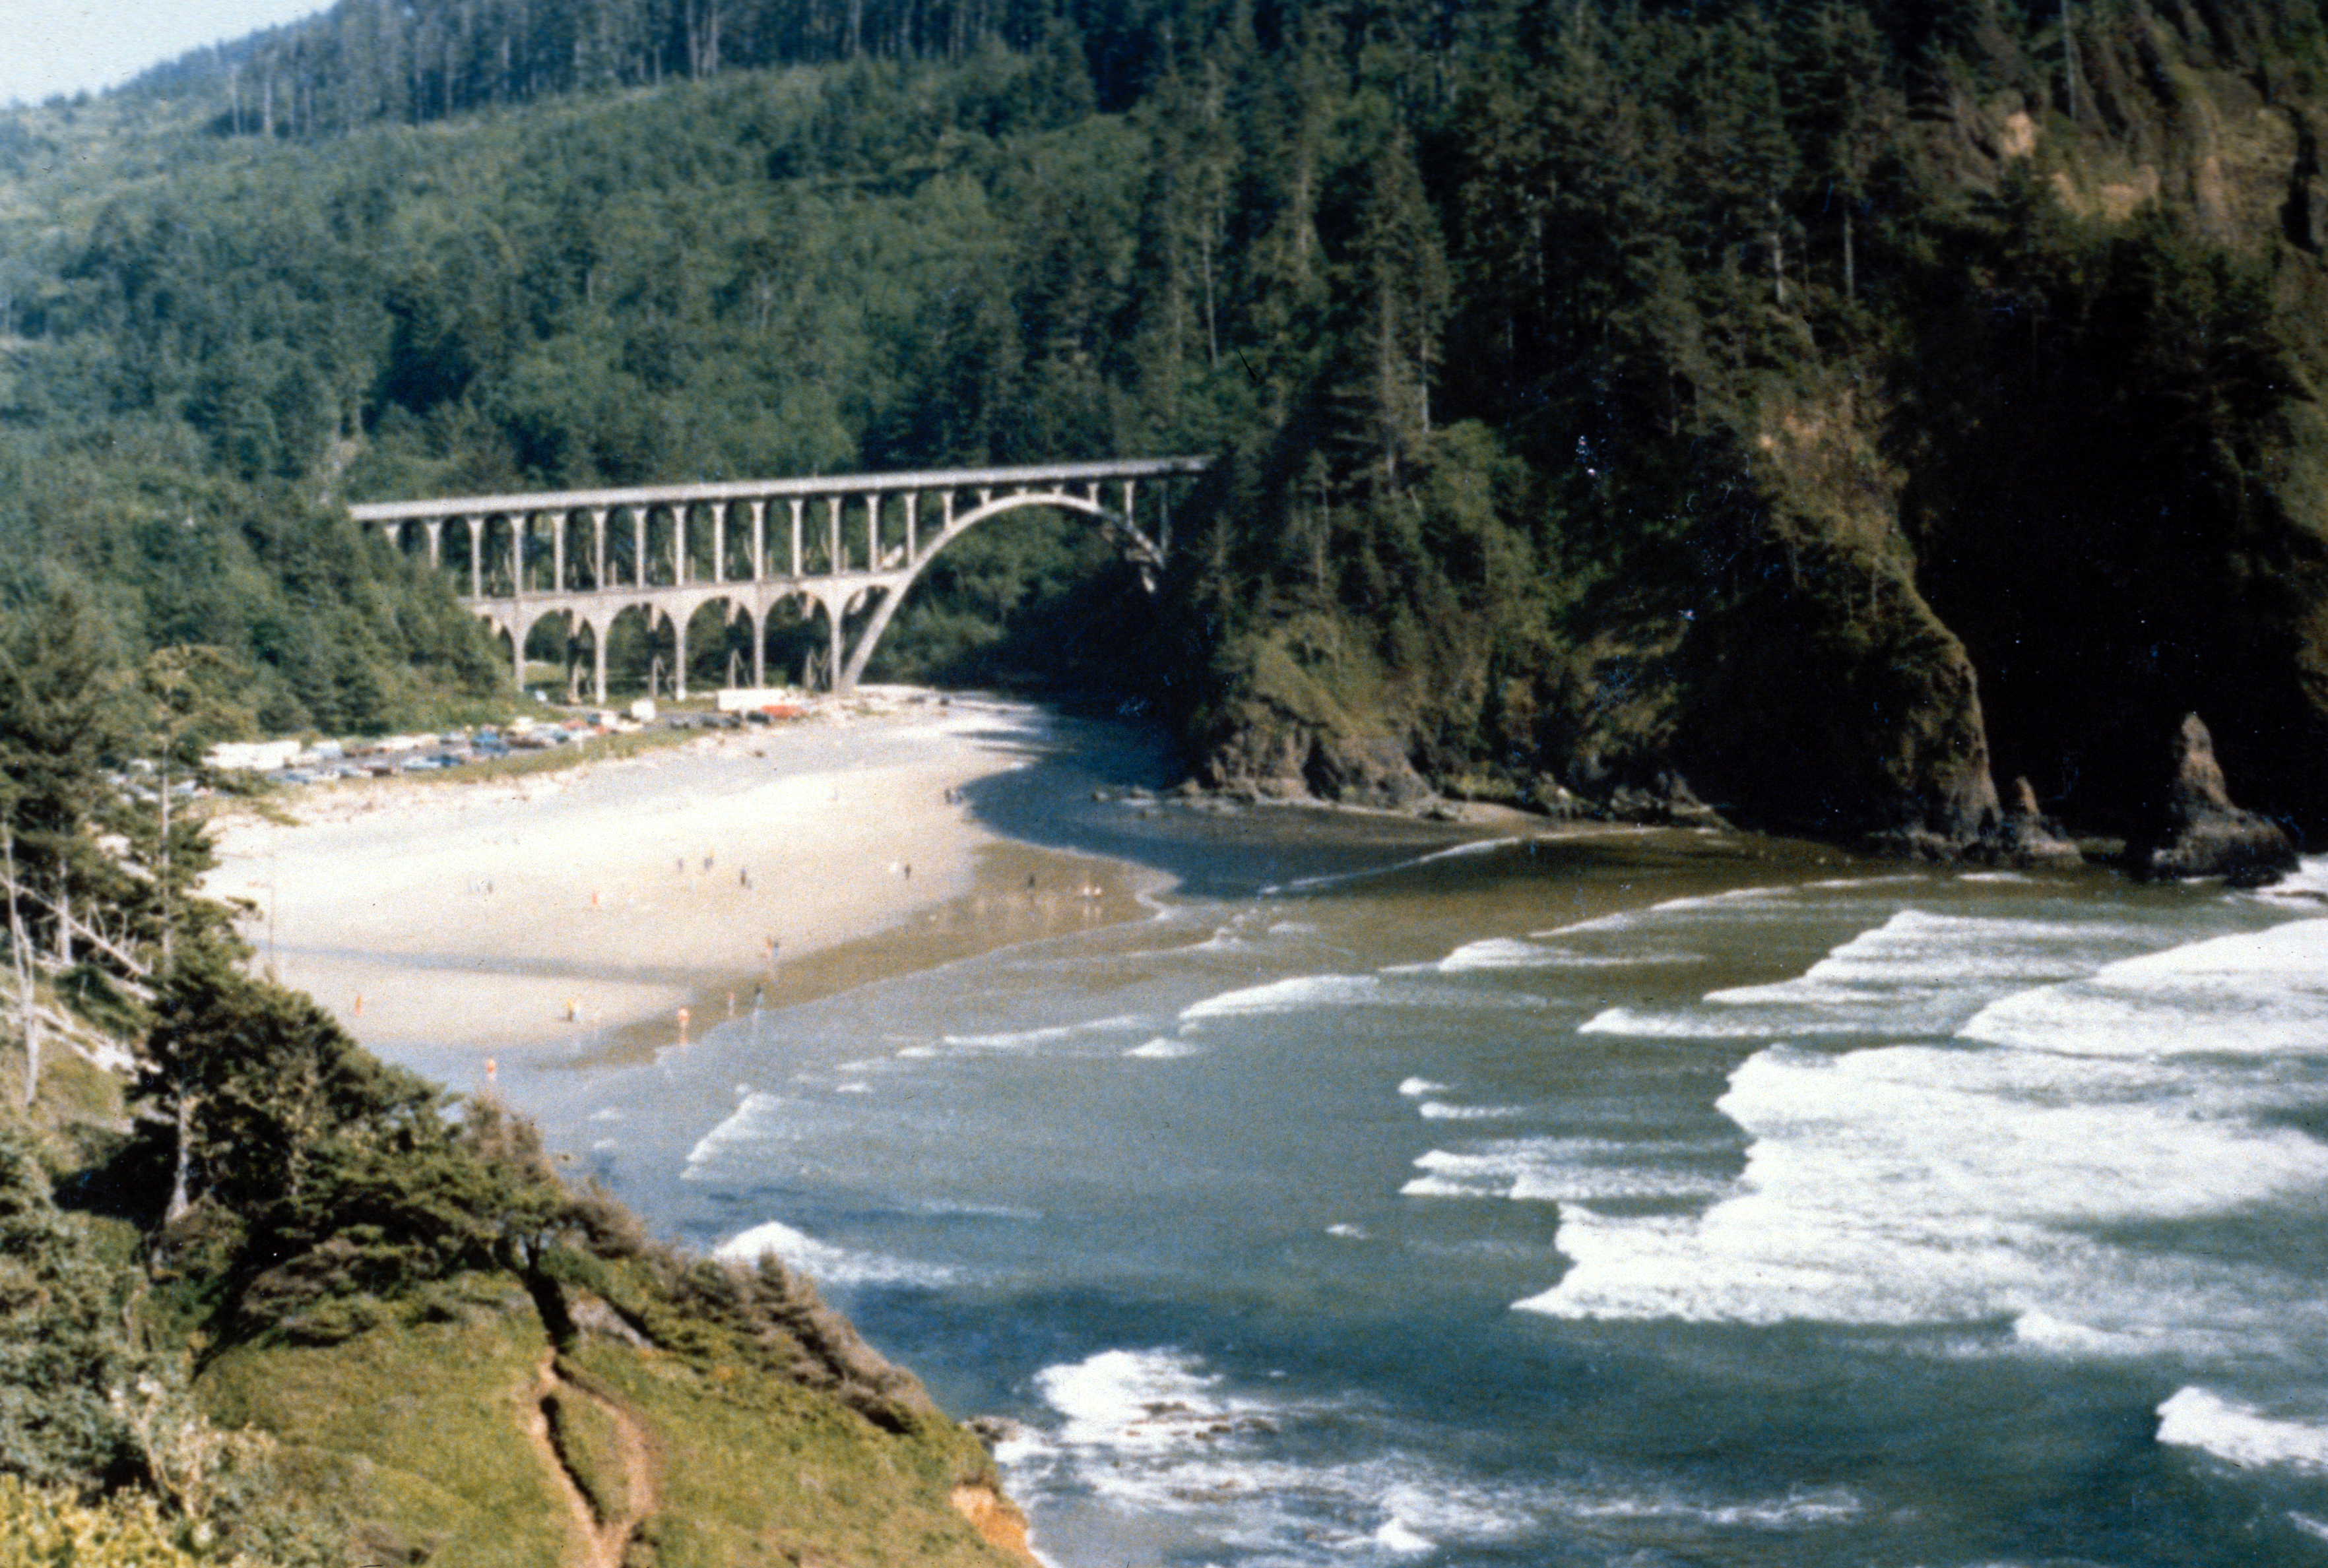
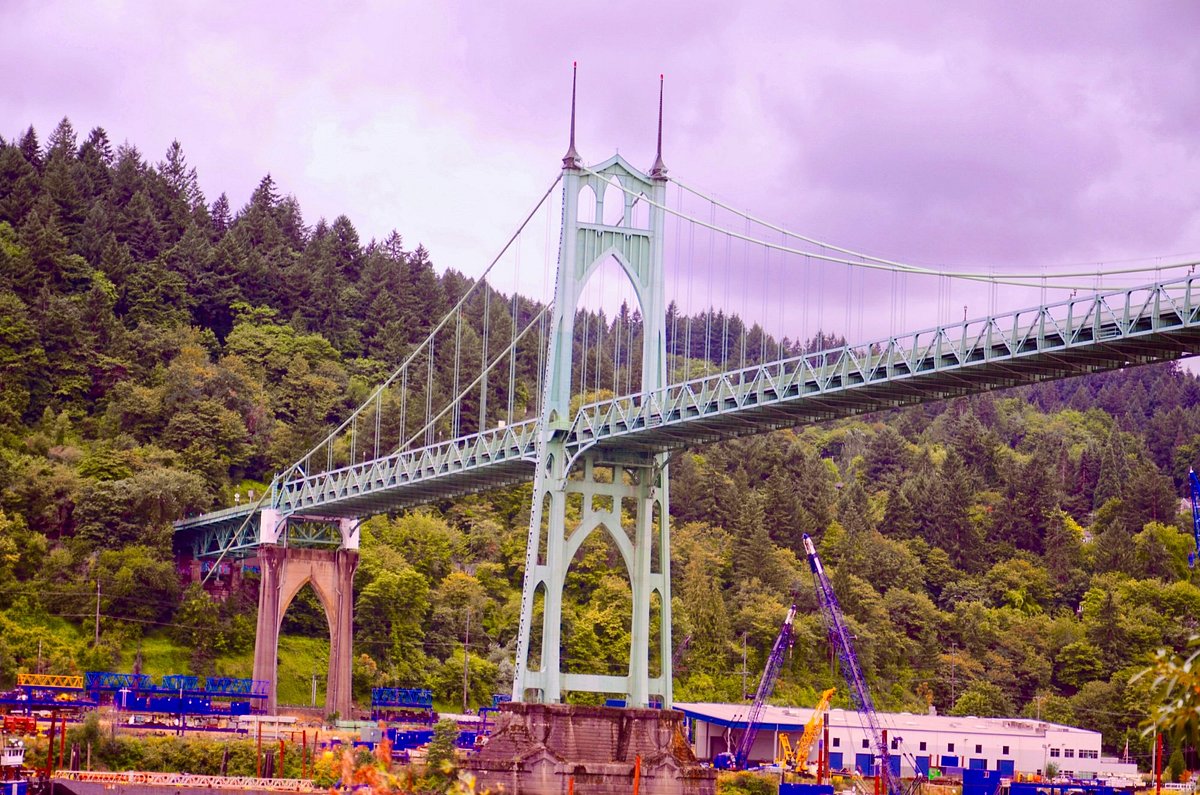
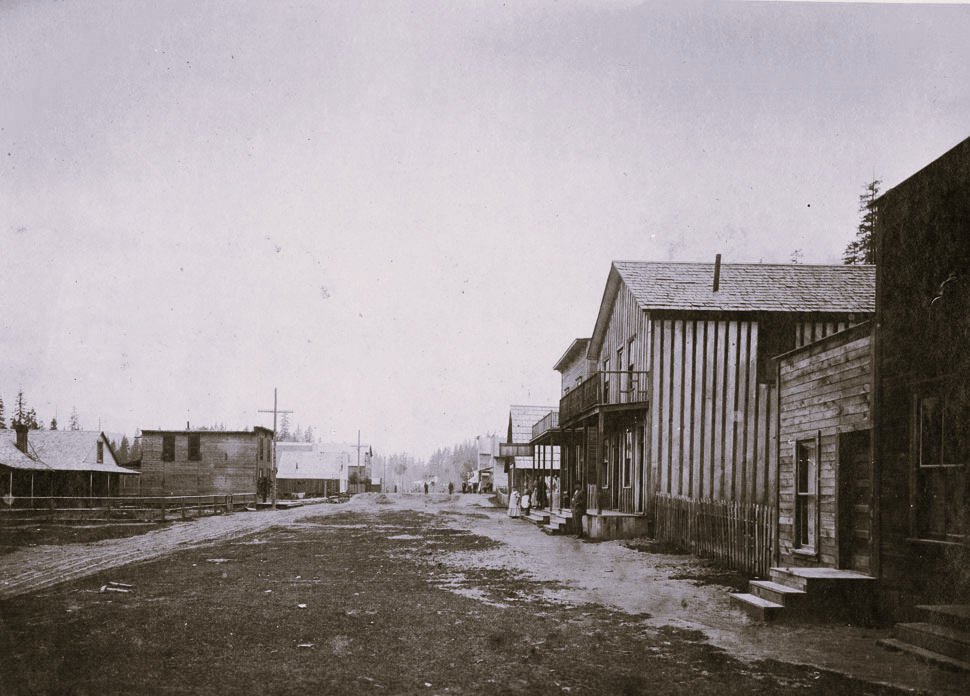
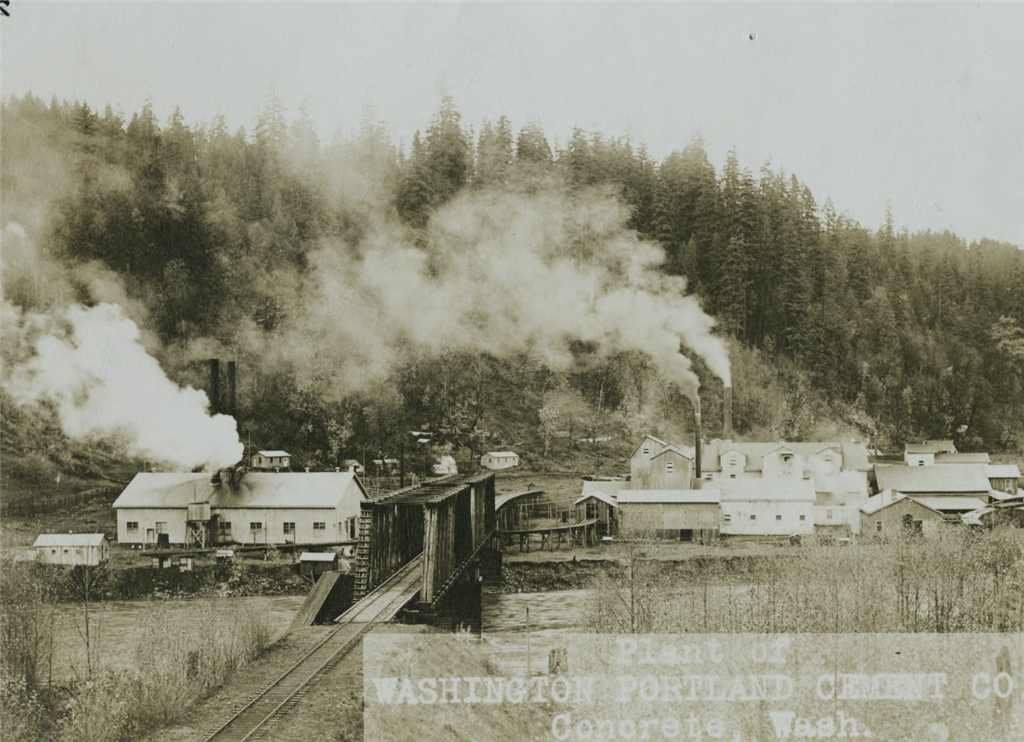
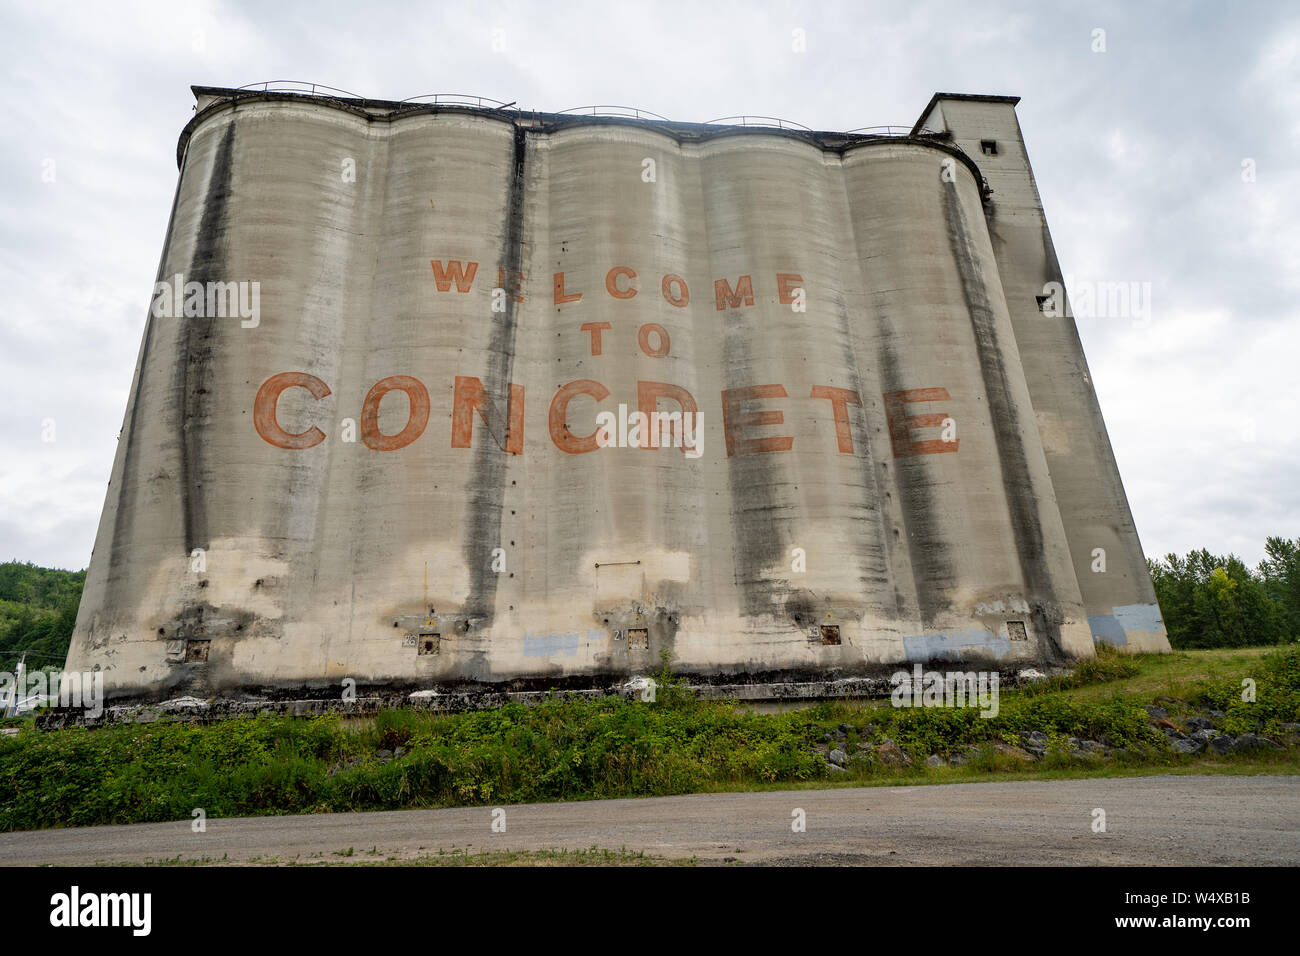
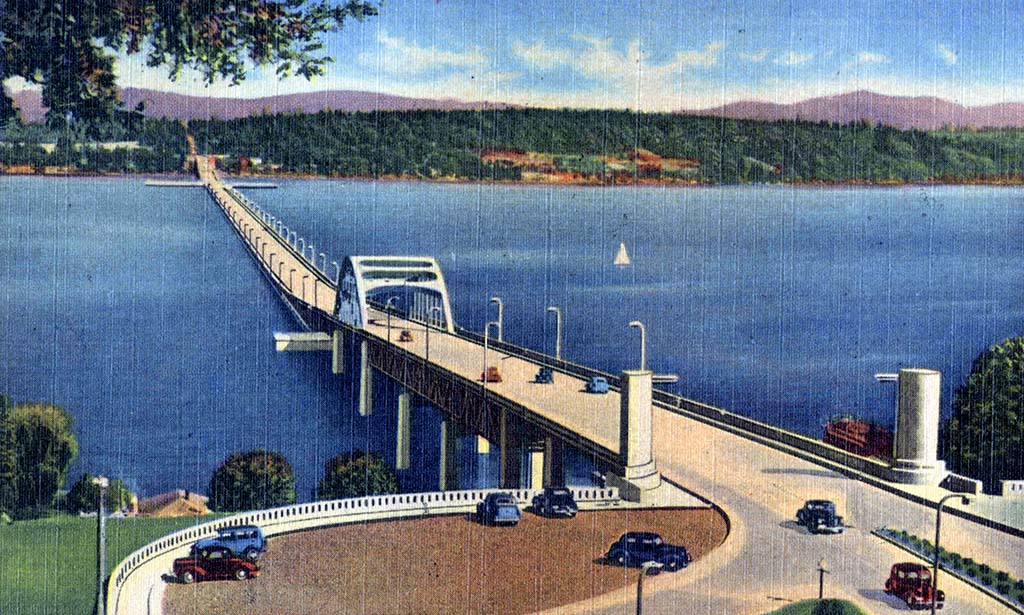
    From the cement booms of Concrete, Washington, to the mega-dams and iconic bridges that defined the 20th century, concrete built the modern Pacific Northwest. Today, as the region leads in low-carbon innovations and heals river ecosystems through dam removals, it charts a path toward resilient, sustainable infrastructure that honors both progress and the environment.

    References and Further Reading (Part 6)

    Thank you for following this 6-part series on the History of Concrete in the Pacific Northwest!

    History of Concrete in the Pacific Northwest Series
  • The History of Concrete in the Pacific Northwest Part 5 of 6 Series – The Modern Era – Ready-Mix Revolution, Companies, and Space-Age Icons

    The History of Concrete in the Pacific Northwest Part 5 of 6 Series – The Modern Era – Ready-Mix Revolution, Companies, and Space-Age Icons

    History of Concrete in the Pacific Northwest – Part 5

    History of Concrete in the Pacific Northwest – Part 5: The Space Age Boom – Century 21 Exposition, Ready-Mix Revolution, and Interstate Expansion

    The early 1960s marked a futuristic pinnacle for concrete in the Pacific Northwest, epitomized by Seattle’s 1962 Century 21 Exposition (Seattle World’s Fair). This “Space Age” showcase featured groundbreaking concrete engineering, including the iconic Space Needle and elevated monorail. Simultaneously, the ready-mix concrete industry exploded, fueling the massive Interstate Highway System builds across Washington and Oregon, transforming regional connectivity and urban landscapes.

    Century 21 Exposition: Concrete Meets the Future

    The 1962 World’s Fair, themed “Man in the Space Age,” attracted over 10 million visitors and left enduring concrete legacies at Seattle Center. Innovative structural designs pushed reinforced concrete to new limits, blending form, function, and optimism.

    The Space Needle (1961–1962): The fair’s centerpiece required an unprecedented foundation: a 30-foot-deep hole filled with 5,580 tons of concrete in a single continuous pour—the largest in the West at the time. The slender tripod legs and flying-saucer top used high-strength concrete and steel, rising 605 feet in just 400 days.

    Space Needle foundation construction, 1961

    Massive underground concrete foundation pour for the Space Needle, 1961 (Courtesy HistoryLink.org)

    Workers preparing Space Needle foundation pour

    Workers and equipment during the record-breaking Space Needle foundation pour (MOHAI)

    Space Needle legs rising during construction

    The Space Needle’s concrete-and-steel legs taking shape, 1961

    Seattle Monorail (1961–1962): The Alweg Monorail, built in under a year, featured 94 elevated concrete support beams along its 1.2-mile route from downtown to the fairgrounds. This rapid-transit prototype showcased precast and prestressed concrete efficiency.

    Seattle Monorail construction, 1961

    Monorail construction showing concrete beam supports at the fair site, 1961 (Courtesy HistoryLink.org)

    Monorail concrete beams under construction

    Precast concrete beams being installed for the Seattle Monorail

    Other fair structures, like the hyperbolic paraboloid Washington State Pavilion (now Climate Pledge Arena) and the concrete-ribbed Opera House, highlighted thin-shell and exposed concrete techniques.

    Opera House at Century 21 Exposition, 1962

    The concrete-ribbed Opera House during the 1962 World’s Fair (Courtesy HistoryLink.org)

    Aerial view of Century 21 Exposition grounds

    Aerial view of the Century 21 Exposition grounds showcasing multiple concrete structures (ASCE)

    The Ready-Mix Revolution and Major Suppliers

    Post-WWII, ready-mix concrete—pre-mixed at plants and delivered in revolving-drum trucks—became dominant, enabling faster, higher-quality pours for large projects. In the PNW, companies like Glacier Northwest (founded in gravel supply in the 1890s, expanded into ready-mix post-war) grew into the region’s powerhouse, later becoming part of CalPortland. By the 1960s, dozens of plants dotted Washington and Oregon, supplying everything from highways to high-rises.

    CalPortland DuPont Ready Mix Plant

    DuPont Ready Mix and Pioneer Aggregate Plant – representative of CalPortland’s modern legacy operations

    Vintage 1960s ready-mix truck

    1960s-era ready-mix concrete truck in action, emblematic of the PNW industry’s growth

    Interstate Highway System: Concrete on a Grand Scale

    The 1956 Federal-Aid Highway Act launched massive interstate construction, with concrete paving miles of I-5, I-90, and I-84 through Washington and Oregon in the 1950s–1970s. Ready-mix supplied the durable slabs that withstood heavy rain and traffic, reshaping commerce and suburbs.

    I-5 construction in Washington, 1960s

    Concrete paving during I-5 construction in Washington state, 1960s (WSDOT Archives)

    Interstate construction in Oregon, 1950s-1960s

    Early interstate highway concrete pour in Oregon (FHWA Archives)

    Conclusion

    The 1960s Space Age optimism, combined with ready-mix innovation and federal funding, propelled concrete into a new era of scale and spectacle in the PNW. These advancements set the stage for today’s sustainable focus, explored in the final part.

    References and Further Reading (Part 5)

    See previous parts for early history, dams, bridges, and architectural landmarks. Part 6 (final) on modern sustainable innovations coming soon!

  • The History of Concrete in the Pacific Northwest Part 4 of 6 Series – Iconic Bridges and Architectural Landmarks

    The History of Concrete in the Pacific Northwest Part 4 of 6 Series – Iconic Bridges and Architectural Landmarks

    History of Concrete in the Pacific Northwest – Part 4

    History of Concrete in the Pacific Northwest – Part 4: Art Deco Elegance and Mid-Century Mastery – Iconic Bridges and Architectural Landmarks

    While massive dams dominated the 1930s–1950s, the Pacific Northwest also excelled in graceful, innovative bridge design and emerging modernist architecture using reinforced concrete. Oregon’s state bridge engineer Conde B. McCullough created a series of Art Deco masterpieces along Highway 101, blending engineering necessity with aesthetic beauty during the Great Depression. Washington contributed dramatic spans like Deception Pass, while cities embraced concrete for bold mid-century and Brutalist structures.

    Conde B. McCullough’s Oregon Coast Bridges: Depression-Era Masterpieces

    From 1919 to 1947, Conde B. McCullough (1887–1946) designed over 600 bridges as Oregon’s state bridge engineer, with his crowning achievements being the five major spans built in the 1930s along the Oregon Coast Highway (U.S. 101) using federal Public Works Administration funds. These reinforced-concrete structures feature elegant Art Deco/Gothic pylons, arches, and obelisks, turning functional crossings into scenic landmarks that helped complete the coastal route and boost tourism.

    Coos Bay Bridge (Conde B. McCullough Memorial Bridge, 1936, North Bend/Coos Bay): The longest of the series at 5,305 feet, this cantilevered through-truss with tied-arch approach spans was the most expensive PWA project in Oregon. Its steel main span (replaced in kind during 2019–2022 rehabilitation) rests on graceful concrete piers with Art Deco detailing.

    Coos Bay Bridge (McCullough Memorial Bridge)

    Conde B. McCullough Memorial Bridge (Coos Bay Bridge), a 1990 HAER photo showing its elegant concrete piers

    Coos Bay Bridge approach spans

    Art Deco detailing on the Coos Bay Bridge approach spans

    Coos Bay Bridge under construction, 1936

    Construction of the Coos Bay Bridge, circa 1936

    Yaquina Bay Bridge (1936, Newport): This steel through-arch with concrete deck-arch approaches is renowned for its sweeping lines and pedestrian plazas on the piers. McCullough’s signature obelisks and fluted pylons add elegance.

    Yaquina Bay Bridge, Newport

    The iconic Yaquina Bay Bridge spanning Newport’s harbor

    Yaquina Bay Bridge from below

    View highlighting the Art Deco pylons of the Yaquina Bay Bridge

    Cape Creek Bridge (1932, near Heceta Head): A 619-foot deck arch with a dramatic 220-foot main span, this bridge curves gracefully over a rugged coastal canyon, framed by old-growth forest and ocean views.

    Cape Creek Bridge

    Cape Creek Bridge curving over the coastal canyon

    Cape Creek Bridge scenic view

    Scenic view of Cape Creek Bridge along the Oregon Coast

    Deception Pass Bridge: Washington’s Dramatic Span

    Completed in 1935, the Deception Pass Bridge connects Whidbey and Fidalgo Islands with two steel cantilever spans supported by towering reinforced-concrete piers. At 180 feet above the swirling tidal waters, it was the only road link north until the 1950s and remains Washington’s most photographed bridge.

    Deception Pass Bridge

    Deception Pass Bridge spanning the dramatic strait

    Modern view of Deception Pass Bridge

    Iconic view from below the Deception Pass Bridge

    Monroe Street Bridge: Spokane’s Early Concrete Arch

    Opened in 1911, the Monroe Street Bridge over the Spokane River was—at 1,377 feet with a 281-foot main span—the largest concrete arch bridge in the U.S. at the time. Its open-spandrel design, ornate railings, and Art Nouveau lamps make it a Spokane landmark.

    Monroe Street Bridge, Spokane

    Monroe Street Bridge spanning the Spokane River gorge

    Historic view of Monroe Street Bridge

    Early 20th-century view of the Monroe Street Bridge

    Mid-Century Concrete Architecture: Brutalism and Beyond

    Post-war, the PNW embraced raw, exposed concrete in Brutalist and modernist designs. Seattle’s Freeway Park (1976, Lawrence Halprin) caps I-5 with bold concrete forms, waterfalls, and greenery—an innovative “lid” park.

    Freeway Park, Seattle

    Brutalist concrete forms of Seattle’s Freeway Park

    Freeway Park waterfalls

    Waterfalls cascading through Freeway Park’s concrete structures

    Other examples include Portland’s Keller Auditorium and various university buildings showcasing béton brut (raw concrete) textures.

    Conclusion

    From McCullough’s poetic coastal spans to dramatic inland arches and bold mid-century forms, concrete in the PNW has proven both structurally daring and artistically expressive. These landmarks continue to define the region’s scenic and urban identity.

    References and Further Reading (Part 4)

    See previous parts for early cement history, mega-dams, Skagit Project, and post-war expansion. Part 5 coming soon on modern innovations!

    History of Concrete in the Pacific Northwest Series
  • The History of Concrete in the Pacific Northwest Part 3 of 6 Series – Post-War Expansion, Iconic Structures, and the Rise of Ready-Mix

    The History of Concrete in the Pacific Northwest Part 3 of 6 Series – Post-War Expansion, Iconic Structures, and the Rise of Ready-Mix

    History of Concrete in the Pacific Northwest – Part 3

    History of Concrete in the Pacific Northwest – Part 3: Post-War Expansion, Iconic Structures, and the Rise of Ready-Mix

    Building on the monumental dam-building era of the 1930s–1950s and Seattle’s Skagit River project, the post-World War II period saw concrete drive explosive urban growth, innovative architecture, and iconic bridges in the Pacific Northwest. The advent of ready-mix concrete revolutionized construction, enabling faster, more consistent builds for highways, skyscrapers, and suburban development. This part explores key post-war dams, landmark bridges, the Space Needle as a symbol of modern concrete use, and the evolution of the ready-mix industry.

    Completing the Columbia River System: Later Dams

    While Grand Coulee and Bonneville kicked off the federal dam-building frenzy, the 1950s–1970s saw completion of the lower Columbia and Snake River hydropower and navigation system under the U.S. Army Corps of Engineers.

    The Dalles Dam (1952–1957, Oregon/Washington border): This run-of-the-river concrete gravity dam, located near The Dalles, Oregon, flooded Celilo Falls—an ancient Native American fishing site—and created Lake Celilo. It generates 1,878 MW and includes locks for navigation. Construction displaced communities and further impacted salmon runs.

    Historical view of The Dalles Dam area and its impact

    The Dalles Dam and surrounding area, showing changes to landmarks and transportation

    John Day Dam (1958–1971, Oregon/Washington): The third-largest hydropower producer on the Columbia (2,160 MW), this concrete gravity dam features one of the world’s largest navigation locks. It required over 10 million cubic yards of concrete and created Lake Umatilla, extending 76 miles upstream.

    Construction of John Day Dam powerhouse

    Construction scene at John Day Lock and Dam powerhouse (University of Idaho Library)

    Modern view of John Day Dam

    John Day Dam on the Columbia River (U.S. Army Corps of Engineers)

    Iconic Bridges: Engineering Marvels in Concrete and Steel

    Post-war growth demanded new crossings, blending concrete with steel for aesthetic and functional designs.

    St. Johns Bridge (1931, Portland, Oregon): Though completed just before the Depression-era dams, this suspension bridge with Gothic-inspired concrete towers became an enduring symbol. Designed by David B. Steinman, its 1,207-foot main span and verdant green paint make it one of America’s most beautiful bridges.

    St. Johns Bridge in Portland

    The magnificent St. Johns Bridge spanning the Willamette River

    Classic view of St. Johns Bridge

    Iconic towers of the St. Johns Bridge (Wikipedia)

    Bullards Bridge (1953, Coos Bay, Oregon): This concrete arch bridge over the Coos River, with its distinctive curved design, replaced an older ferry and exemplifies mid-century coastal engineering.

    Historic Bullards Bridge

    Bullards Bridge near Bandon, Oregon

    Driving across Bullards Bridge

    View from Bullards Bridge (Wikipedia)

    The Space Needle: A Modern Concrete Icon (1961–1962)

    For the 1962 Seattle World’s Fair (Century 21 Exposition), the Space Needle showcased futuristic concrete use. Its foundation required a massive 30-foot-deep hole filled with 5,600 tons of concrete—the largest continuous pour in the West at the time. The slender legs and saucer top used reinforced concrete and steel, symbolizing the Space Age.

    Space Needle foundation construction

    Underground construction of the Space Needle foundation, 1961 (HistoryLink.org)

    Early construction of Space Needle

    Early stages of Space Needle construction (PBS)

    The Rise of Ready-Mix Concrete in the PNW

    Ready-mix concrete—batched off-site and delivered in trucks—transformed construction after WWII. Companies like Glacier Northwest (now CalPortland, roots in the 1890s Puget Sound gravel supply) expanded into ready-mix, becoming the region’s largest supplier. By the mid-20th century, ready-mix enabled rapid interstate highway builds, urban expansion in Seattle and Portland, and consistent quality for large projects.

    Historical concrete plant construction

    Early 20th-century concrete plant construction scene (representative of PNW industry growth)

    Today, firms like CalPortland and others operate dozens of plants across Washington, Oregon, and beyond, incorporating sustainable practices like recycled aggregates.

    Conclusion

    The post-war era cemented concrete’s role in the PNW’s identity—from powering growth via dams to defining skylines and coastlines. As the region grapples with aging infrastructure and climate resilience, concrete continues to evolve.

    See Part 1 (early history, mega-dams, bridges) and Part 2 (Skagit Project) for the full series.

    History of Concrete in the Pacific Northwest Series
  • The History of Concrete in the Pacific Northwest Part 2 of 6 Series – The Skagit River Hydroelectric Project

    The History of Concrete in the Pacific Northwest Part 2 of 6 Series – The Skagit River Hydroelectric Project

    History of Concrete in the Pacific Northwest – Part 2

    History of Concrete in the Pacific Northwest – Part 2: The Skagit River Hydroelectric Project

    While the Columbia River Basin’s Grand Coulee and Bonneville Dams represent the pinnacle of New Deal-era federal mega-projects, the Pacific Northwest’s concrete legacy also includes a remarkable municipal achievement: Seattle City Light’s Skagit River Hydroelectric Project. Developed between the 1910s and 1960s, this series of three massive concrete dams—Gorge, Diablo, and Ross—transformed the remote upper Skagit River gorge into a powerhouse that still supplies about 20% of Seattle’s electricity today. These dams showcase innovative concrete engineering in one of the most challenging terrains in North America, with steep canyons, heavy rainfall, and frequent natural hazards.

    Origins and Vision: J.D. Ross and Early Planning

    The project traces its roots to 1917, when James Delmage (J.D.) Ross, superintendent of Seattle’s municipal lighting department (later Seattle City Light), secured federal approval to develop hydropower on the Skagit River. Facing rapid urban growth and the limitations of existing sources, Ross envisioned a cascade of dams to harness the river’s immense flow. In 1919, the city approved bonds, and construction infrastructure began: a 25-mile private railroad from Rockport to the gorge to transport materials and workers, bypassing public roads to prevent private utility encroachment.

    The company town of Newhalem sprang up at the railroad’s end, complete with housing, schools, and amenities. Delays plagued early work—floods, avalanches, labor strikes, forest fires, and even workers chasing gold rushes—but the vision persisted.

    Gorge Dam: The First Step (1921–1961)

    Construction on the lowest dam, Gorge Dam, began in 1921 downstream near Newhalem. Initially, a temporary wooden crib dam was built due to cost constraints, with plans for a permanent concrete structure later. Power first reached Seattle in September 1924, formally dedicated by President Calvin Coolidge remotely. The original wooden dam was replaced by the concrete Gorge High Dam, completed in 1961—a 300-foot gravity dam that raised the powerhouse capacity significantly.

    Gorge High Dam on the Skagit River, completed in 1961 Historic 1926 view of Gorge Dam intake with railroad, Skagit River

    Diablo Dam: The World’s Tallest (1927–1936)

    Work on the middle dam began in 1927, five miles upstream in the narrow Diablo Canyon. This concrete thin-arch dam, completed in 1930, stood 389 feet tall—making it the world’s tallest dam at the time (surpassed soon after by Owyhee Dam in Oregon). Financial woes from the Great Depression delayed the powerhouse until 1936. Innovative features included an incline lift (still operable for tours) to transport equipment from river level to the dam crest, and a barge system on the emerging Diablo Lake.

    Diablo’s turquoise lake became an iconic sight, and the dam exemplified advanced concrete arch design, relying on the canyon walls to bear water pressure.

    Diablo Dam under construction, January 1931 Vintage 1920s real photo postcard of Diablo Dam, Skagit River

    Ross Dam: The Giant Upstream (1937–1949)

    The uppermost and largest dam, originally called Ruby Dam, began construction in 1937. Renamed Ross Dam in 1939 to honor J.D. Ross after his death, this concrete thin-arch structure was built in phases: reaching 305 feet by 1940, then raised further postwar. Final height of 540 feet was achieved by 1949, creating Ross Lake, which extends 23 miles into Canada.

    Controversy arose over plans to raise it further (High Ross proposal), which would flood more Canadian land. After decades of debate, the 1984 treaty with British Columbia capped the height, with Seattle agreeing to purchase power instead.

    Ross Dam under construction in 1947 1950 press photo of completed Ross Dam on the Skagit River Modern view of Ross Dam and Ross Lake

    Legacy, Innovations, and Impacts

    The Skagit Project cost over $250 million across decades and pioneered public tours in the 1920s–1930s to build support, including meals at the Gorge Inn, train rides, and incline lifts—traditions revived today as “Skagit Tours.” All three dams are on the National Register of Historic Places.

    Like Columbia Basin dams, the Skagit project altered ecosystems, blocking historic salmon runs above Gorge Dam and affecting flows. Seattle City Light has implemented flow regimes, fish habitat funds, and collaborates with tribes (Upper Skagit, Swinomish, Sauk-Suiattle) and Canadian First Nations for mitigation. The project was the first large hydro facility certified as Low Impact in 2003. Relicensing efforts continue, with the previous license expiring in 2025.

    The Skagit dams highlight municipal innovation in concrete engineering, powering Seattle through growth while navigating environmental and international challenges—a enduring chapter in PNW concrete history.

    For Part 1 of this series (covering early cement towns, Columbia dams, bridges, and modern sustainability), see the previous post.

    History of Concrete in the Pacific Northwest Series
  • The History of Concrete in the Pacific Northwest Part 1 of 6 Series

    The History of Concrete in the Pacific Northwest Part 1 of 6 Series

    History of Concrete in the Pacific Northwest – Part 1

    History of Concrete in the Pacific Northwest – Part 1

    The Pacific Northwest (PNW), encompassing Washington and Oregon, has a storied history with concrete, driven by its abundant natural resources like limestone, aggregates, and rivers. From early cement production booms to monumental public works projects during the Great Depression, concrete has shaped the region’s infrastructure, economy, and landscape. This article explores the evolution of concrete in the PNW, from its humble beginnings in the late 19th century to modern sustainable innovations, while also addressing the environmental impacts of large-scale concrete dams.

    Pre-1900: Early Settlements and Resource Discovery

    Concrete’s roots in the PNW trace back to the 1870s and 1880s, when homesteaders began settling along rivers like the Baker and Skagit. In 1871, pioneers near the Baker River established a community initially called “Minnehaha,” meaning “waterfall” in Dakota. By 1890, the town-site was platted by Magnus Miller, and a post office was set up, adopting the name “Baker.” Early settlers, including Amasa Everett who arrived in 1875, discovered clay and limestone deposits essential for cement production. These resources laid the foundation for the industry’s growth. Lumber mills and the arrival of the Great Northern Railway in 1901 spurred development, but it was the cement boom that truly transformed the area.

    Early 20th Century: The Cement Production Boom and the Town of Concrete

    The early 1900s marked the rise of cement manufacturing in the PNW, exemplified by the town of Concrete, Washington. In 1905, the Washington Portland Cement Company (WPCC) established the state’s first Portland cement plant on the east bank of the Baker River, producing cement by 1906 from local limestone quarries. This led to the formation of “Cement City.” In 1908, the Superior Portland Cement Company (SPCC) built a rival plant on the west bank in Baker, shipping its first cement that year. By 1909, the two communities merged and incorporated as Concrete, with a population of about 1,200. Daniel Dougal Dillard became the first mayor.

    The plants employed hundreds, peaking at 160–200 workers, producing up to 5,200 barrels daily. Infrastructure followed: a county bridge in 1906, electric lights and water systems by SPCC in 1909-1910, and the Concrete District School in 1910. Fires in 1915 and the 1920s destroyed wooden structures, leading to concrete rebuilds for fire resistance. SPCC acquired WPCC in 1919, becoming the largest cement producer on the Pacific Coast. Production continued until 1969, when dust pollution, high costs, and air quality regulations forced closure. The stacks were demolished in 1973, and sites repurposed into parks like Silo Park.

    Population peaked at 1,200 in 1909 but declined post-industry to under 800 by 2020 (797 in the latest census). The town features historic structures like the Henry Thompson Bridge (1916-1918, once the world’s longest single-span concrete bridge), the Concrete Theatre (1923), and the old town hall (1908). The silos, painted “Welcome to Concrete” for the 1993 film This Boy’s Life, remain iconic.

    Main Street in Concrete, Washington, circa 1908

    Main Street in Concrete, Washington, circa 1908 (Courtesy HistoryLink.org)

    Washington Portland Cement Plant in Concrete, Washington

    Early view of the Washington Portland Cement Plant in Concrete, Washington (Courtesy HistoryLink.org)

    Iconic 'Welcome to Concrete' silos in Concrete, WA

    Iconic “Welcome to Concrete” silos, a landmark made from the town’s historic cement structures

    Welcome sign on silos in Concrete, Washington

    Another view of the famous silo welcome sign in Concrete, Washington

    1930s–1940s: The Era of Mega-Dams

    The Great Depression catalyzed massive concrete projects under the New Deal, focusing on hydropower, flood control, and irrigation. These dams employed thousands and powered WWII industries like aluminum production.

    Grand Coulee Dam (1933–1942, Eastern Washington): The largest concrete structure in the U.S. upon completion, it used nearly 12 million cubic yards of concrete—three times that of Hoover Dam. Construction began in 1933, involving land clearing, town relocations, and WPA camps. Key innovations included cooling pipes to manage curing heat and on-site batching plants. It remains the nation’s top hydropower producer, generating about 1,000 average megawatts annually.

    Grand Coulee Dam under construction, historical view

    Workers and equipment during Grand Coulee Dam construction (Bureau of Reclamation)

    Historical construction scene at Grand Coulee Dam

    Massive scale of concrete pouring at Grand Coulee Dam (Smithsonian Magazine)

    Another historical photo of Grand Coulee Dam construction

    Early stages of Grand Coulee Dam construction (Bureau of Reclamation)

    Bonneville Dam (1933–1937, Columbia River near Portland): A gravity dam key for navigation and power, it began generating electricity in 1938. Construction involved over 3,000 workers and was a Depression-era success. The first powerhouse was completed in 1938, making it the oldest in the Federal Columbia River Power System.

    Aerial view of Bonneville Dam area, circa 1938

    Aerial view of Bonneville Dam area, circa 1938

    Historical view of Bonneville Dam

    Bonneville Dam on the Columbia River (U.S. Army Corps of Engineers)

    Mid-20th Century: Bridges, Urban Growth, and Post-WWII Expansion

    Post-WWII, concrete facilitated urban expansion. The Lake Washington Floating Bridge (Lacey V. Murrow Memorial Bridge, 1940) was revolutionary: the world’s first major reinforced-concrete pontoon floating bridge. Proposed by Homer Hadley in 1921, it used 25 pontoons (350 feet long, 60 feet wide) with watertight cells, anchored in deep water. Opened July 2, 1940, it saved 14 miles of travel. Renamed in 1967, it sank partially in 1990 due to storm damage but reopened in 1993.

    Lacey V. Murrow Memorial Bridge circa 1940

    The original Lake Washington Floating Bridge shortly after opening, circa 1940 (Courtesy HistoryLink.org)

    Modern view of the Lacey V. Murrow Memorial Bridge

    Modern aerial view of the I-90 floating bridges, including the Lacey V. Murrow Memorial Bridge

    Companies like Glacier Northwest (now CalPortland) expanded ready-mix supply for Seattle and Portland’s growth. Early concrete skyscrapers in Seattle, like those in the 1910s-1920s, showcased regional innovations in high-rise construction.

    Modern Era: Innovations in Sustainable Concrete

    Today, the PNW leads in greener concrete to combat cement’s 8% contribution to global CO2 emissions. Innovations include:

    • Granulated slag from steel mills replacing Portland cement in projects like the Seattle Storm’s facility and Amazon Spheres.
    • Algae-based substitutes for limestone in Microsoft data centers.
    • Carbon-negative cement using biochar from Washington State University.
    • Eco Material Technologies’ Lakeview, Oregon plant producing 300,000 tons/year of low-carbon alternatives.
    • Solid Carbon’s use of processed sewage as a sand replacement.

    These advancements support sustainable building in high-demand areas like Sound Transit’s rail expansions.

    Environmental Impacts: The Double-Edged Sword of Concrete Dams

    While concrete dams brought economic benefits, they devastated ecosystems. Over 400 dams in the Columbia Basin block fish migration, slowing flows and raising temperatures, causing up to 50% juvenile salmon mortality. Salmon populations have declined 90%, costing $14 billion in recovery efforts. The U.S. government acknowledged harms to tribes in 2024. Dam removals, like on the Elwha River (2011), have restored habitats, increasing salmon returns. Proposals to breach Lower Snake River dams could quadruple Chinook Salmon populations, with energy offsets via renewables.

    Conclusion

    Concrete has been integral to the PNW’s development, from cement towns to iconic dams and bridges. As the region moves toward sustainability, balancing innovation with environmental stewardship remains key.

    For Part 2 of this series (covering the Skagit River Hydroelectric Project), see the next post.

    History of Concrete in the Pacific Northwest Series
  • The Evolution of Concrete: Interactive Timeline of American Innovations | Volume Concrete

    🇺🇸 The Evolution of Concrete: Interactive Timeline of American Innovations

    Welcome to Volume Concrete’s interactive learning experience! Dive into the fascinating history of concrete, with a spotlight on groundbreaking American innovations that have shaped our nation’s infrastructure. Click on the red dots along the timeline to reveal details about each milestone. From ancient roots to modern marvels, discover how concrete has built the backbone of America – strong, resilient, and forward-thinking.

    Proudly Serving America’s Builders Since 1985
    1824: Portland Cement Invention

    While invented in England by Joseph Aspdin, Portland cement quickly crossed the Atlantic, laying the foundation for U.S. mass production in the 1870s. This “artificial stone” revolutionized building, enabling stronger, more durable structures across America.

    1889: First U.S. Reinforced Concrete Bridge

    Ernest L. Ransome builds the Alvord Lake Bridge in San Francisco – America’s first reinforced concrete bridge. This innovation combined steel and concrete for unmatched strength, paving the way for skyscrapers and highways.

    1891: First Concrete Street in America

    George Bartholomew pours the nation’s first concrete street in Bellefontaine, Ohio. Testing at 8,000 psi, it still stands today – a testament to American ingenuity and the durability that Volume Concrete delivers in every pour.

    1930: Air-Entraining Agents

    Invented in the U.S., these additives create microscopic air bubbles in concrete, improving freeze-thaw resistance. Essential for harsh American winters, this breakthrough extended concrete’s lifespan in roads and bridges nationwide.

    1936: Hoover Dam Completion

    An American engineering icon, the Hoover Dam used over 3 million cubic yards of concrete – the largest pour at the time. It powered the West and showcased U.S. capability in massive infrastructure projects.

    1956: Interstate Highway System

    President Eisenhower’s vision launches the largest public works project in history, using billions of tons of concrete. This network connected America, boosting economy and mobility – a legacy Volume Concrete continues today.

    1970s-80s: High-Performance Additives

    U.S. innovations like superplasticizers, silica fume, and fiber reinforcements create stronger, more workable concrete. These advancements enable taller buildings and sustainable designs in modern American cities.

    2006: Self-Healing Concrete

    Developed with U.S. research contributions, this smart concrete uses bacteria or capsules to auto-repair cracks. It’s revolutionizing durability for future infrastructure, reducing maintenance costs for American projects.

    Today & Beyond: Sustainable Concrete

    At Volume Concrete, we’re leading with low-carbon mixes like Type IL cement and recycled aggregates. American innovations in carbon capture and AI-optimized designs promise a greener future for our nation’s builds.

    What did you learn from this timeline? Concrete isn’t just material – it’s the story of American progress. Ready to build your next project with Volume Concrete’s expert ready-mix? Contact us today for a quote!

  • Pipe Friction Loss Calculator

    Pipe Friction Loss Calculator

    Pipe Friction Loss Calculator

    Pipe Friction Loss Calculator

    Helpful for pool, spa, and sprinkler plumbing. Uses Schedule 40 PVC (C=150 by default), Hazen-Williams equation. Adjust C based on pipe material and age.

    Overview of the Hazen-Williams EquationThe Hazen-Williams (H-W) equation is an empirical formula used to estimate frictional head loss or pressure drop in water pipes, particularly for applications like water supply networks, fire sprinklers, and irrigation systems. It relates flow velocity to pipe roughness, hydraulic radius, and energy slope, but is limited to water at near-room temperature (around 60°F or 15.6°C) under turbulent flow conditions, with no adjustments for viscosity, density, or temperature variations. It assumes a constant roughness coefficient (C) independent of Reynolds number, which simplifies calculations but reduces accuracy for non-standard fluids or conditions.The general form is:

    V=k⋅C⋅R0.63⋅S0.54V = k \cdot C \cdot R^{0.63} \cdot S^{0.54}V = k \cdot C \cdot R^{0.63} \cdot S^{0.54} where:

    • ( V ): velocity (ft/s in US units, m/s in SI),
    • ( k ): conversion factor (1.318 for US, 0.849 for SI),
    • ( C ): roughness coefficient,
    • ( R ): hydraulic radius,
    • ( S ): energy slope (head loss per unit length).

    This derives from the Chézy formula but uses exponents (0.63 and 0.54) fitted to experimental data for better constancy of C over typical ranges.Variations in Formula FormsThe H-W equation appears in multiple forms depending on the desired output (e.g., head loss, flow rate, pressure drop) and units. These are not fundamental modifications but adaptations for engineering convenience.US Customary (Imperial) Units

    • Pressure Drop (PSI per foot):Spsi/ft=4.52⋅Q1.852C1.852⋅d4.8704S_{\text{psi/ft}} = \frac{4.52 \cdot Q^{1.852}}{C^{1.852} \cdot d^{4.8704}}S_{\text{psi/ft}} = \frac{4.52 \cdot Q^{1.852}}{C^{1.852} \cdot d^{4.8704}}where ( Q ) is flow in gallons per minute (GPM), ( d ) is inside diameter in inches. (Note: Some sources use 4.73 as the constant with Q in cubic feet per second and d in feet.)
    • Head Loss (feet of water):hf=0.002083×L×(100C)1.85×GPM1.85d4.8655h_f = 0.002083 \times L \times \left( \frac{100}{C} \right)^{1.85} \times \frac{\text{GPM}^{1.85}}{d^{4.8655}}h_f = 0.002083 \times L \times \left( \frac{100}{C} \right)^{1.85} \times \frac{\text{GPM}^{1.85}}{d^{4.8655}}where ( L ) is pipe length in feet.

    SI (Metric) Units

    • Head Loss (meters):S=hfL=10.67⋅Q1.852C1.852⋅d4.8704S = \frac{h_f}{L} = \frac{10.67 \cdot Q^{1.852}}{C^{1.852} \cdot d^{4.8704}}S = \frac{h_f}{L} = \frac{10.67 \cdot Q^{1.852}}{C^{1.852} \cdot d^{4.8704}}where ( Q ) is flow in m³/s, ( d ) in meters, ( L ) in meters. Pressure drop is then hf×ρgh_f \times \rho gh_f \times \rho g (with water’s specific weight).

    These forms maintain the core exponents but adjust constants for unit consistency.Key Modifications and VariationsWhile the standard H-W is widely used for its simplicity (no iterations needed, ~10% accuracy vs. more complex models for water pipes), variations address limitations like pipe aging, non-uniform flow, or integration with other equations.

    1. Modified Hazen-Williams Equation:
      • Designed for analyzing aging pressure pipe systems, providing a more accurate estimate of frictional resistance and reduced capacity without arbitrarily lowering C.
      • Differs from standard H-W by incorporating a roughness coefficient starting at 1 for very smooth (new) pipes, which decreases for rougher or aged pipes (e.g., due to buildup). This avoids over-reliance on subjective C reductions.
      • Applications: Water distribution modeling, especially in software like Bentley WaterCAD for long-term system simulations. It has less computational demand than Darcy-Weisbach or Colebrook-White but better reflects real-world degradation.
      • Exact formula not detailed in sources, but it modifies the C term or slope calculation to account for progressive roughness.
    2. Corrections for Irrigation Laterals (Modified H-W for Friction and Local Losses):
      • A specialized adaptation for non-uniform outflow in irrigation pipes (e.g., sprinklers or drip lines), combining H-W with Darcy-Weisbach (D-W) insights.
      • Comparison: D-W is more general (uses friction factor f, valid for any fluid/velocity) but varies along laterals due to changing discharge; H-W is empirical and power-based, assuming uniform conditions.
      • Proposed correction: Adjusts the H-W C coefficient via a power-function form for D-W losses, with empirical parameters based on pipe traits and discharge range. Includes local head losses, velocity changes, and outflow nonuniformity.
      • Key finding: Friction loss follows a discharge-power form; validated for sprinkler/trickle systems via numerical examples.
      • Applicability: Improves accuracy in varying-flow scenarios like agriculture, where standard H-W underestimates losses.
    3. Empirical Relations to Darcy-Weisbach Equation:
      • H-W vs. D-W Similarities: Both calculate frictional head loss; H-W is a simplified, water-specific proxy for D-W under standard conditions.
      • Differences: H-W ignores fluid properties (fixed for water at ~60°F, inaccurate for additives/high velocities >25 ft/s); D-W incorporates viscosity, density, and Reynolds number for broader use (e.g., non-water fluids, large pipes).
      • When to Use: H-W for quick water pipe calcs (velocities 10-20 ft/s, e.g., sprinklers); D-W for high-velocity mist systems or variable fluids (requires iteration).
      • Empirical Relation (for plastic pipes): For cold/hot water (20-60°C, diameters 15-50 mm, flows 0.25-2 L/s),hD−W=1.0007⋅hH−W0.9993h_{D-W} = 1.0007 \cdot h_{H-W}^{0.9993}h_{D-W} = 1.0007 \cdot h_{H-W}^{0.9993}where ( h ) is head loss per unit length (m/m). Correlation R² = 0.9993; simplifies conversions without f or Re calcs, but limited to small plastic pipes (deviations >50 mm).

    Roughness Coefficient (C) VariationsC values vary by material and age to simulate “variations” in pipe condition (higher C = smoother). Typical ranges:

    MaterialNew CAged C (e.g., 20 years)
    PVC/FRP/Polyethylene150140-150
    Copper130-140120-130
    Cement-Lined Ductile Iron140130-140
    Asbestos-Cement140120-130
    Cast Iron13089-100
    Galvanized Iron120100-110
    Concrete100-14090-120
    Steel90-12080-100

    These adjustments indirectly modify the equation for real-world use. For precise applications, consult standards like AWWA for velocity-specific C measurements.

  • PSI Liquids Guide

    PSI Liquids Guide

    Understanding PSI in Liquids | Volume Concrete

    Unlocking the Power of PSI in Liquids

    Discover how pressure drives your hydraulic systems and fluid projects—essential knowledge for concrete pros!

    PSI in Liquids: The Basics

    PSI, or Pounds per Square Inch, is a standard English unit of pressure—the force applied per unit area.1 In liquids, PSI quantifies how much force a fluid exerts on a surface, such as the walls of a pipe or tank. Unlike solids, liquids transmit pressure evenly in all directions, making PSI a key measure for hydraulic systems, plumbing, and fluid storage.

    In a liquid at rest (hydrostatic condition), pressure increases with depth due to the weight of the fluid above. The formula in English units is approximately P (PSI) = 0.433 × h (feet) for water at standard conditions (density ~62.4 lb/ft³).2 This means at 10 feet of water depth, the pressure at the bottom is about 4.33 PSI—enough to push against submerged surfaces.

    For other liquids, adjust by specific gravity (SG): P (PSI) = 0.433 × SG × h (feet). For example, seawater (SG 1.025) at 10 feet yields ~4.44 PSI.

    Difference Between PSI (Pressure) and Flow

    PSI measures static pressure—the “push” or force from the fluid without motion.3 Flow, however, is the volume of liquid moving per unit time, typically in Gallons Per Minute (GPM) in English units. High PSI doesn’t guarantee high flow; it depends on restrictions like pipe size or valves.

    Aspect PSI (Pressure) Flow (e.g., GPM)
    Definition Force per area (lb/in²). Static or dynamic. Volume per time (gal/min). Indicates movement.
    Units PSI GPM, FPS (feet per second)
    Relationship Drives flow; higher PSI can increase GPM if unrestricted (Bernoulli’s principle). Reduces pressure drop across systems; too high can cause turbulence.
    Example 50 PSI in a garden hose nozzle for spray force. 5 GPM through the hose for watering rate.

    In short: PSI is like the “strength” behind the water; flow is how much water actually moves.

    PSI in a Closed System: Pascal’s Law

    In a closed system (sealed container with incompressible liquid like water or oil), Pascal’s Law states that any change in pressure applied to the fluid is transmitted undiminished to every point in the fluid and the container walls.4 This isotropic (equal in all directions) pressure exists throughout because liquids don’t compress much, so the force propagates instantly.

    For example, in a hydraulic jack: Pressing a small piston (1 in² at 100 lb force = 100 PSI) transmits that exact 100 PSI to a larger piston (10 in²), lifting 1,000 lb—multiplying force via area difference, but pressure stays uniform.5

    This principle powers car brakes, lifts, and presses, ensuring even pressure distribution without loss.

    Hydrostatic Pressure vs. Depth in Water

    Visualize how PSI builds with depth in a closed water column:

    Interactive Hydrostatic Pressure Calculator

    Calculate PSI at a given depth in a liquid-filled closed system. Enter depth in feet and specific gravity (1.0 for water).


    PSI in Concrete Pumping: Dynamic Pressures in Action

    In concrete pumping, PSI represents the hydraulic pressure generated by the pump to propel the semi-fluid concrete mix through hoses, booms, and pipes—treating the mix like a high-viscosity liquid.6 Unlike static hydrostatic pressure, this is a dynamic process: PSI fluctuates continuously with each piston stroke of the pump, peaking during the push phase and dropping during the intake.7 Typical operating ranges are 800–1,500 PSI for standard jobs, but spikes can hit 2,000+ PSI under resistance.

    Key factors influencing these pressure changes include:

    • Machine Stroke: Each full stroke (piston extension/retraction) builds pressure as the cylinder compresses and pushes the mix. Longer strokes in larger pumps allow for smoother, lower average PSI, while shorter strokes in smaller machines cause more frequent, sharper fluctuations.
    • Slump of the Concrete: Slump measures workability (higher slump = more fluid, 4–6 inches typical for pumping). Wetter mixes (higher slump) flow easier, requiring 20–30% less PSI; drier, stiffer mixes (lower slump, e.g., 2–4 inches) demand higher PSI to overcome friction, risking hose bursts if over 1,200 PSI.
    • Material Content: Aggregate size (e.g., 3/4-inch max for pumps), water-cement ratio, and admixtures (like superplasticizers for fluidity) directly impact viscosity. High aggregate content increases resistance, raising PSI by up to 50%; optimized mixes with fly ash or silica fume reduce it for efficiency.

    Monitoring PSI via gauges is crucial for safety—excessive buildup signals blockages. Pro tip: Prime lines with water or grout to stabilize initial pressures.8

    For concrete pumping or fluid handling projects, understanding PSI ensures safe, efficient systems. Contact Volume Concrete for expert advice!

    © 2025 Volume Concrete. Educational content powered by real-world engineering insights.1-8

  • Post Tensioning Concrete

    Post-Tensioning Concrete Tutorial: Mechanisms, Process, and Requirements | VolumeConcrete.com

    Post-Tensioning Concrete: A Comprehensive Technical Tutorial

    A deep dive into the engineering principles and construction requirements of PT systems.

    1. What is Post-Tensioning and How Does it Work?

    Active Reinforcement vs. Passive Reinforcement

    Traditional reinforcement (rebar) is **passive**; it only engages after the concrete has already cracked or begun deflecting under load. Post-Tensioning is **active**. It involves creating a permanent, internal compressive force within the concrete member, effectively reversing the tension created by loads and shrinkage before it can cause structural distress.

    Illustration showing the internal compression force applied by tendons.
    The post-tensioned tendon compresses the concrete, neutralizing the tensile forces that naturally occur under load (flexure).

    The Tendon System

    • Tendons: High-strength steel strands (usually 7-wire strands) bundled together.
    • Sheathing: Plastic or metal ducts surrounding the tendons, preventing direct bond with the concrete (in unbonded systems). This sheathing is often filled with grease for corrosion protection and friction reduction.
    • Anchorages: Specialized steel assemblies (anchors and wedges) used to mechanically lock the stressed tendon to the hardened concrete member.

    2. Step-by-Step PT Installation Process (The PTI Standard)

    PT installation is a highly sequenced process that must strictly follow engineering plans and material specifications.

    1. Engineering Design: Before any work begins, a registered structural engineer designs the slab, calculating the exact required **pre-stressing force** and the precise parabolic or harped profile of the tendons to counteract anticipated loads.
    2. Placement of Tendons: The sheathed tendons are secured to the forms or subgrade using chairs, ensuring their profile matches the engineered design. Improper height or alignment drastically compromises the system.
    3. Concrete Pour and Curing: The concrete (using a specific low-shrinkage, high-early-strength mix design) is poured. Crucially, the concrete must reach a predetermined minimum compressive strength (often $f’c=3,000$ psi or higher) before stressing can begin.
    4. The Stressing Operation:
      • Hydraulic jacks, calibrated specifically for the tendon size, are attached to the anchorage.
      • The tendon is pulled (“stressed”) until it reaches the force specified by the engineer (typically 80% of the tendon’s guaranteed ultimate tensile strength ($F_{pu}$)).
      • The contractor verifies the force using two methods: a pressure gauge reading on the jack and a physical measurement of the strand elongation. Both must match the engineer’s calculations within tolerance.
    5. Anchoring and Grouting: Once the required force is achieved, steel wedges are seated in the anchorage to mechanically lock the tendon. The excess strand is cut off, and the anchor pocket is filled with grout for permanent corrosion and fire protection.

    3. Critical Requirements for PT Construction Success

    Warning: The Dangers of Unqualified PT Work

    Stressed tendons hold enormous energy. A failure in the anchorage, poor concrete quality, or improper stressing procedures can result in a sudden, catastrophic release of the tendon, posing an extreme hazard to life and property. Do not attempt this work without certified expertise.

    Specialized Engineering Design
    PT design is complex, requiring expertise in calculating friction losses, elastic shortening, long-term creep, and relaxation. The design must conform to ACI 318 (Building Code Requirements for Structural Concrete) and PTI guidelines.
    Certified Installation & Inspection
    The contractor must employ PTI-certified field personnel who are trained in the use of calibrated jacking equipment, proper shoring removal, and strict adherence to the stressing logs and elongation tables provided by the engineer.
    Concrete Mix Design
    PT demands specific characteristics from the concrete mix:
    • **High Early Strength:** To permit stressing within 3–7 days, speeding up construction.
    • **Low Shrinkage:** Minimizes long-term stresses and cracking before the PT system is fully active.

    4. Why PT is Used: Applications and Structural Benefits

    When properly engineered and installed, PT offers compelling advantages over traditional reinforced concrete, making it the preferred method for specific types of structures.

    • Longer Spans: PT greatly reduces deflection, allowing for shallower beams and slabs to span much greater distances without intermediate supports (e.g., parking garages).
    • Crack Control: The constant compression minimizes the formation of tension cracks caused by drying shrinkage and thermal movement, crucial for durability in bridges and water-retaining structures.
    • Slabs-on-Grade (SoG): In regions with expansive or highly reactive soils, PT SoG foundations are designed to lift and support the entire building monolithically, mitigating the effects of differential soil movement.